Deep Learning Image Reconstruction to Improve Computed Tomography Image Quality of the Phantom with Standard Liver Density
-
摘要:
目的:通过使用不同的扫描剂量,扫描模拟标准肝脏密度体模,比较深度学习重建技术(DLIR)与自适应统计迭代重建技术(ASIR-V)重建图像的质量。方法:使用Gammex标准CT体模模拟标准肝脏密度的插入物(ρew=1.06),在6种不同辐射剂量水平(CTDIvol:30、20、15、10、7.5和4.5mGy)下进行CT扫描。随后,使用DLIR和ASIR-V算法,对每种剂量下获得的图像进行重建。通过imQuest软件对图像进行质量分析,使用Bland-Altman方法比较DLIR算法在4.5mGy(本实验采用的最低辐射剂量)和ASIR-V在15mGy(肝脏扫描推荐剂量)下的图像质量。结果:在6种剂量水平下,DLIR在噪声(P<0.001)、信噪比(P<0.001)、对比噪声比(P<0.001)和可检测度(P<0.001)等关键指标上,均显著优于ASIR-V。Bland-Altman分析结果表明,在4.5mGy的剂量水平下,DLIR的图像质量显著优于ASIR-V在15mGy剂量水平下的表现。在4.5mGy下DLIR图像的噪声为17.41±0.32,显著低于ASIR-V在15mGy的21.17±0.67(P<0.001)。在4.5mGy下DLIR的信噪比、对比噪声比和可检测度分别为3.21±0.24,3.42±0.35和8.81±0.63,显著高于ASIR-V在15mGy剂量下的2.69±0.14,2.87±0.11和5.61±1.28(P值分别为0.006、0.029和0.005)。结论:在模拟标准肝脏密度的局灶性病变体模CT扫描实验中,DLIR相较于ASIR-V,不仅显著提升信噪比,对比噪声比和可检测度值,而且大幅度降低图像噪声。DLIR技术能够在4.5mGy的较低辐射剂量下,实现优于常规15mGy剂量下ASIR-V重建图像的质量效果。
Abstract:Objective: This study aimed to compare the quality of reconstructed images by deep learning image reconstruction (DLIR) and adaptive statistical iterative reconstruction-V (ASIR-V) techniques at different scan doses using a phantom with liver density. Methods: The Gammex computed tomography (CT) phantom with a standard liver-density insert (ρew=1.06) was scanned at six different radiation doses (CTDIvol; 30, 20, 15, 10, 7.5, and 4.5 mGy). Images obtained at each dose were reconstructed using DLIR and ASIR-V. Image quality was analyzed through the imQuest software. The quality of reconstructed images by DLIR at 4.5 mGy (lowest radiation dose) and ASIR-V at 15 mGy (recommended scan dose) were compared using the Bland–Altman method. Results: Across the six doses, DLIR significantly outperformed ASIR-V in key metrics, such as noise (P<0.001), signal-to-noise ratio (SNR) (P<0.001), contrast-to-noise ratio (CNR) (P<0.001), and detectability index (d') (P<0.001). Bland–Altman analysis indicated that the quality of reconstructed images by DLIR at 4.5 mGy was significantly better to those by ASIR-V at 15 mGy. The noise level of DLIR images at 4.5 mGy was 17.41±0.32, which is significantly lower than that of ASIR-V at 15 mGy (21.17±0.67) (P<0.001). At 4.5 mGy, DLIR SNR, CNR, and d' were 3.21±0.24, 3.42±0.35, and 8.81±0.63, respectively, which are significantly higher than that of ASIR-V at 15 mGy (2.69±0.14, 2.87±0.11, and 5.61±1.28, respectively) (P=0.006, 0.029, and 0.005 respectively). Conclusion: In CT scan of focal liver-density lesions using a phantom, DLIR significantly improved the SNR, CNR, and d' values and reduced image noise compared to ASIR-V. DLIR was able to achieve better quality image reconstruction at 4.5 mGy than the conventional ASIR-V reconstruction at 15 mGy.
-
Keywords:
- CT /
- deep learning /
- phantom /
- radiation dose
-
随着肝脏恶性肿瘤的发病率持续上升,肝脏局灶性病变的准确鉴别和诊断非常关键[1]。在各种检查手段中,肝脏多时相增强CT扫描在探测肝病变方面得到了广泛应用[2]。然而,该检查方式需要患者多次重复扫描,这增加了辐射剂量累积的风险。据报道,多时相肝脏CT扫描的剂量可达到标准腹部和骨盆CT扫描的两倍[3]。由于肝脏CT图像的软组织对比度相对较低,因此,实现高质量图像重建并有效检测出病灶显得尤为重要。这一挑战是在保障图像质量的基础上,实现放射剂量的显著降低,并确保病灶的准确检出[4]。迭代重建技术(iterative reconstruction,IR)是一种广泛应用的图像重建算法,在降低辐射剂量的同时,为提升图像质量提供了可行方案[5]。比如,肝脏图像重建常用的一种IR技术是自适应统计迭代重建(adaptive statistical iterative reconstruction-V,ASIR-V)[6]。尽管IR技术在医学成像领域具有广泛的应用,但由于其非线性计算特性,在处理超低剂量CT生成高噪声图像中经常出现失真现象[7]。这种情况在一定程度上影响了对疾病的诊断。
近年来,深度学习图像重建(deep learning image reconstruction,DLIR)技术,作为一种利用神经网络模型训练以优化图像质量的方法,为低剂量CT扫描的发展提供了新的途径。通过应用DLIR技术,能够在维持图像空间分辨率和缩短重建时间的同时,有效降低图像中的噪声和伪影,同时保持噪声的纹理特征和组织的解剖细节[8-9]。与IR技术相比,基于神经网络的DLIR展现出在提升图像质量方面的显著优势,特别是在提高信噪比(signal-to-noise ratio,SNR)和对比噪声比(contrast-to-noise ratio,CNR)方面[10-11]。标准体模研究和腹部肿瘤临床研究均表明,DLIR技术在大幅减少辐射剂量的同时,能够显著提升图像质量[8,12]。
为了在尽可能降低CT剂量的同时保证肝脏病灶的显示质量,需要首先进行标准肝脏密度体模研究。鉴于此,本研究通过使用不同的扫描剂量,扫描模拟标准肝脏密度体模,比较DLIR与ASIR-V图像重建的质量,从而探索DLIR图像重建算法在低对比度图像质量提升方面的潜力。此外,我们比较DLIR算法在4.5 mGy(本实验采用的最低辐射剂量)和ASIR-V在15 mGy(肝脏扫描推荐剂量)[13]下的图像质量,通过定量分析探索DLIR在确保显示肝病变时所能达到的最低辐射剂量。
1. 材料与方法
1.1 研究体模
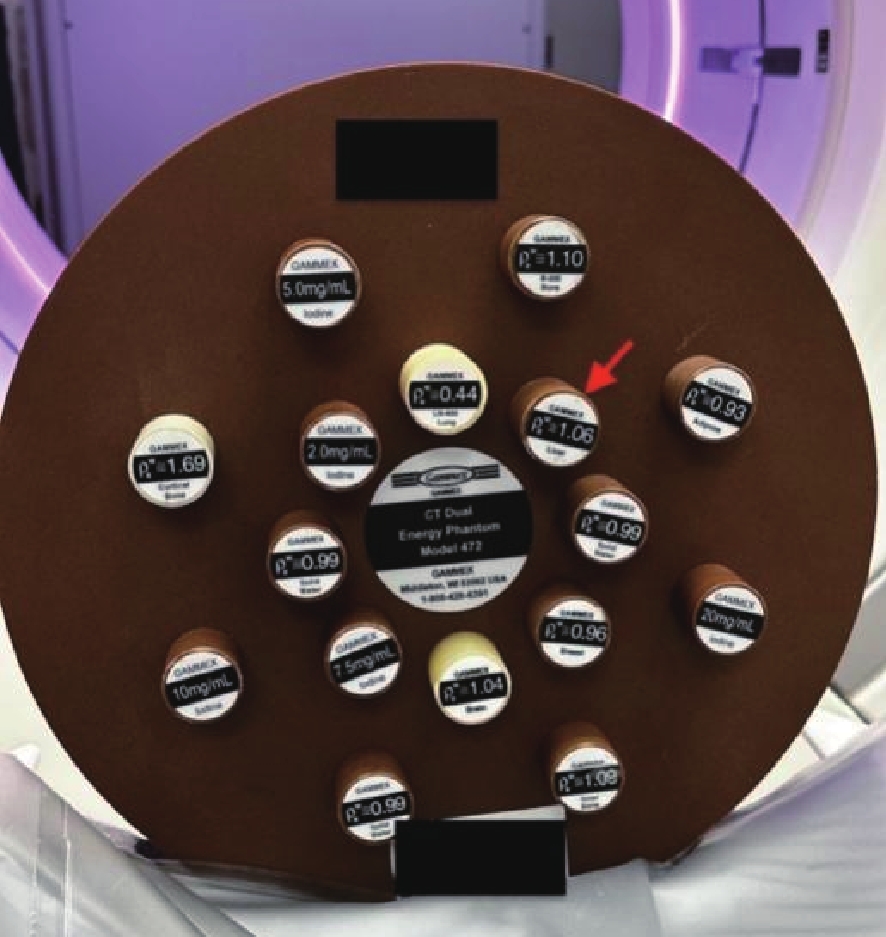
本研究使用标准体模(Gammex CT phantom,model 472,Sun Nuclear)[14]。此体模设计为直径33 cm、层厚5 cm的圆盘形状,内含16个直径2.8 cm、长7 cm的插入物,用于模拟不同的人体组织密度。在本实验中,我们特别测量了代表标准肝脏密度(ρew=1.06)的插入物(图1箭头指示)。在整个扫描过程中,体模的位置始终保持固定不变。
![]() 图 1 Gammex CT体模的照片,箭头所指是代表标准肝脏密度(1.06 g/cm3)的插入物Figure 1. Image of the Gammex CT phantom shows an insert that represents liver density (1.06 g/cm3) (arrow)
图 1 Gammex CT体模的照片,箭头所指是代表标准肝脏密度(1.06 g/cm3)的插入物Figure 1. Image of the Gammex CT phantom shows an insert that represents liver density (1.06 g/cm3) (arrow)1.2 CT扫描和算法重建
使用一台256排CT(Revolution CT,GE医疗)完成体模扫描工作(图1)。在进行扫描时,参照腹部诊断CT扫描参数设置(表1),将管电压设定为120 kVp[15],并根据需要调整管电流,以产生6种不同的辐射剂量(CTDIvol:30、20、15、10、7.5和4.5 mGy)。其中,以15 mGy的剂量为标准的腹部扫描剂量[13]。重建图像的层厚和层距都是1.25 mm,重建图像视野为30 cm×30 cm,图像重建矩阵为512×512。为了评估不同重建算法的效果,我们将体模扫描图像重建两次:一次使用高强度DLIR(DLIR-H)算法,另一次使用50%强度ASIR-V(ASIR-V-50%)算法作为对照。为确保数据的准确性,模拟不同扫描间CT值的微小差异,我们在每种剂量条件下对体模进行5次重复扫描。
表 1 CT设备的参数Table 1. Parameters of CT Equipment变量 参数 管电压 120 kVp 层厚 1.25 mm 辐射剂量 CTDIvol 30、20、15、10、7.5、4.5 mGy 视野 30.0 cm×30.0 cm 重建图像矩阵 512×512 重建算法 ASIR-V-50%,DLIR-H 1.3 定量图像质量分析
本研究使用imQuest软件(版本7.2,Duke大学)进行系统的图像质量定量分析。分析过程中,主要测量了平均CT值(Hounsfield unit,HU)、图像噪声、SNR和CNR。计算SNR和CNR的公式如下,这里以水为基准计算CNR:
$$ \mathrm{SNR=HU}_{ \mathrm{object}} \mathrm{/SD}_{ \mathrm{object}} \mathrm{,} $$ (1) $$ \mathrm{CNR=(HU}_{ \mathrm{object}} \mathrm{–HU}_{ \mathrm{watermean}} \mathrm{)/SD}_{ \mathrm{watermean}} \mathrm{。} $$ (2) 其次,我们通过测量噪声功率普(noise power spectrum,NPS)和基于任务的传递函数(task-based transfer function,TTF)对图像噪声纹理和空间分辨率进行分析。NPS空间分布频率(NPS spatial frequency,NPS-fpeak)是指NPS达到峰值(NPS-peak)所对应的频率,这一指标用于评估图像的噪声纹理和噪声数值幅度,而TTF用于评价图像的空间分辨率[16]。此外,为更客观地评估图像质量,本研究引入可检测度
$d' $ (detectability index)作为评价指标,它与图像质量呈正相关关系[2,16]。1.4 统计学
正态分布的定量数据以均值±标准差的形式表示。经P-P图检验,所有数据均呈现正态分布特征,因此我们采用成组t检验比较两组之间的差异。使用Bland-Altman分析评价DLIR算法在4.5 mGy(本实验的最低辐射剂量)和ASIR-V在15 mGy(肝脏扫描推荐剂量)的图像质量差异。本研究使用GraphPad Prism 10和SPSS Statistics 27统计软件包进行数据分析,考虑P<0.05具有统计学意义。
2. 结果
2.1 体模扫描
在6种不同辐射剂量条件下(即CTDIvol为30、20、15、10、7.5和4.5 mGy),使用多层CT成功扫描代表标准肝脏密度的标准体模,对DLIR和ASIR-V两种图像重建算法的图像质量进行全面评估。
2.2 DLIR与ASIR-V重建图像的基本测量
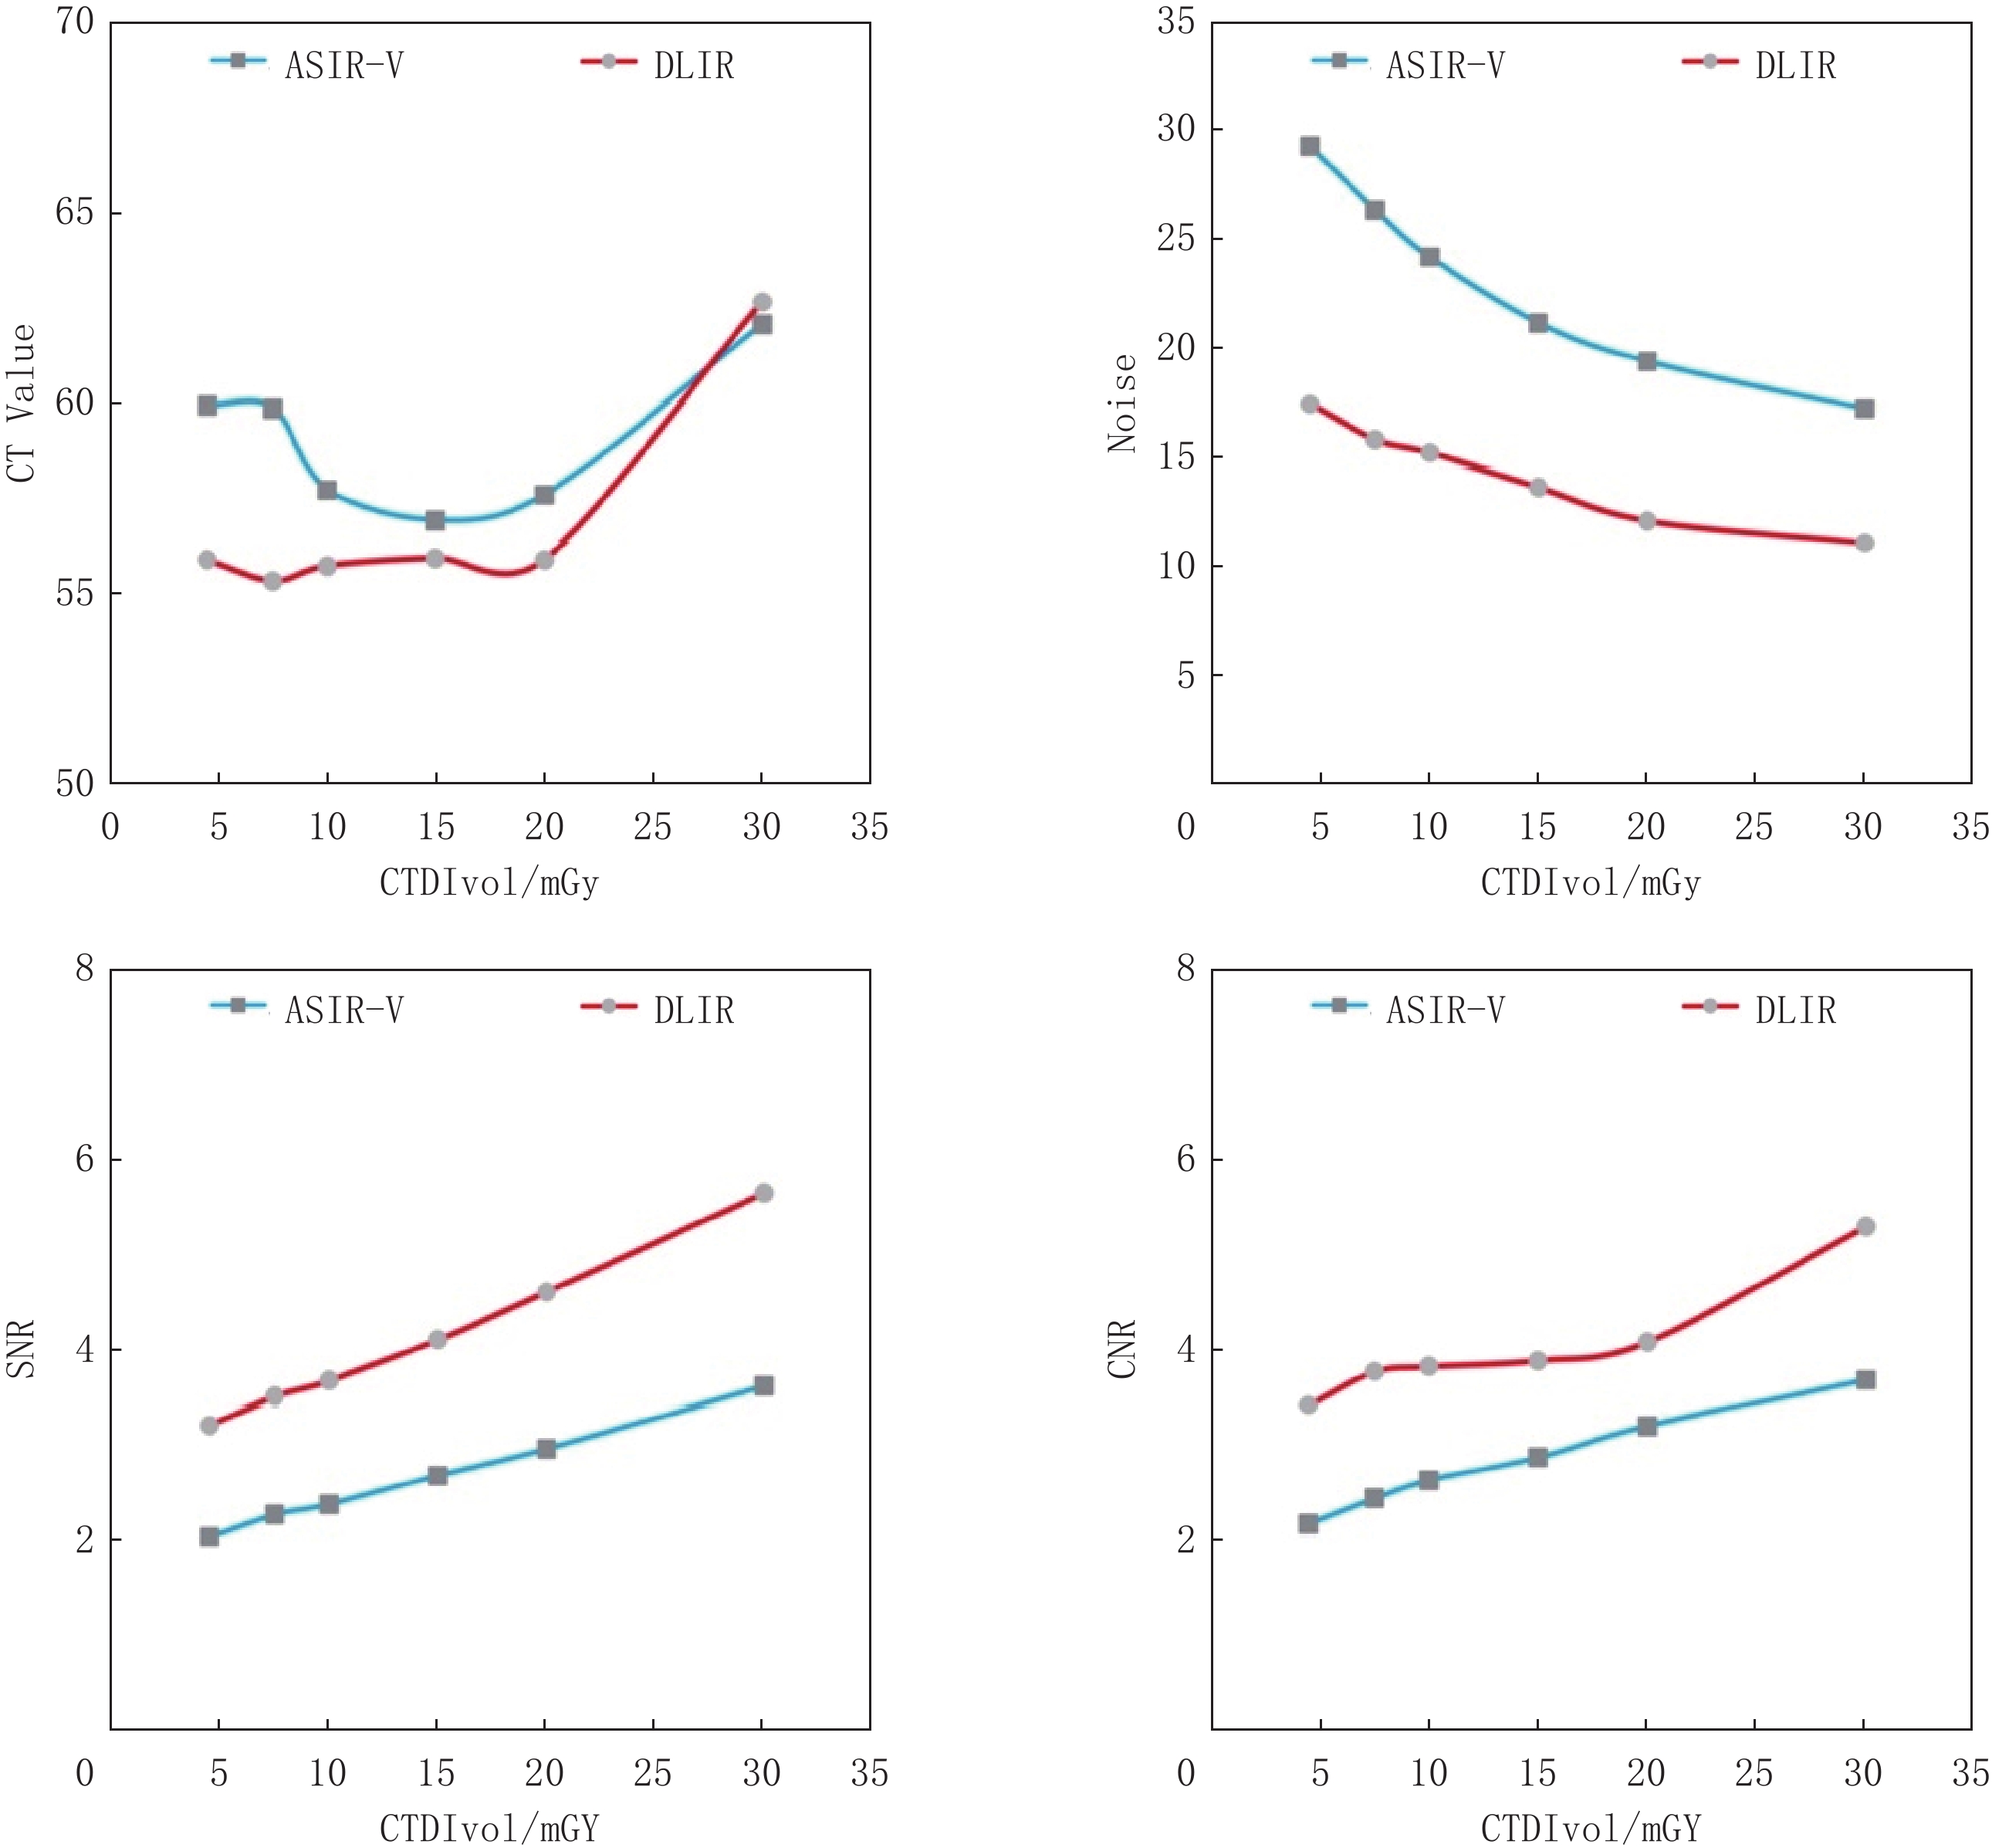
表2记录了在不同辐射剂量条件下,两种算法重建图像的CT值、噪声、SNR和CNR的平均值及标准差。图2展示了这些关键指标随辐射剂量变化的趋势。在30 mGy的剂量下,DLIR的CT值高于ASIR-V。而在其它剂量下,DLIR的CT值均显著低于ASIR-V(P=0.001)。关于噪声水平,我们发现随着辐射剂量的增加,噪声水平逐渐降低。值得注意的是,在所有的剂量水平上,DLIR算法的噪声都显著低于ASIR-V(P<0.001)。对于SNR和CNR,随着剂量增加,这两个指标呈上升趋势。在所有剂量条件下,DLIR算法的SNR和CNR均显著超过ASIR-V(P<0.001)。这些数据统计结果表明,DLIR算法在多个关键性指标上均展现出一定的优势。
表 2 在不同辐射剂量下,DLIR与ASIR-V算法重建图像的测量值比较Table 2. Comparison of measurements of reconstructed images by DLIR and ASIR-V algorithms at different radiation dosesCTDIvol/mGy CT value(P=0.001) Noise(P<0.001) SNR(P<0.001) CNR(P<0.001) DLIR ASIR-V DLIR ASIR-V DLIR ASIR-V DLIR ASIR-V 30 62.66±3.17 62.06±3.55 11.12±0.69 17.19±1.05 5.65±0.38 3.62±0.19 5.3±0.12 3.69±0.15 20 55.91±2.08 57.58±2.81 12.15±0.34 19.39±0.33 4.61±0.22 2.97±0.15 4.09±0.26 3.2±0.17 15 55.94±1.7 56.91±2.27 13.66±0.55 21.17±0.67 4.1±0.16 2.69±0.14 3.89±0.26 2.87±0.11 10 55.74±2.18 57.71±3.17 15.18±0.3 24.19±1.06 3.67±0.1 2.39±0.17 3.83±0.33 2.63±0.27 7.5 55.35±2.32 59.86±3.34 15.79±0.57 26.37±1.5 3.51±0.2 2.28±0.24 3.78±0.14 2.44±0.17 4.5 55.88±3.31 59.94±4.77 17.41±0.32 29.33±0.91 3.21±0.24 2.05±0.2 3.42±0.35 2.18±0.3 ![]() 图 2 在不同辐射剂量下,DLIR与ASIR-V算法重建图像的测量值趋势图Figure 2. Trend of measured values of reconstructed images by DLIR and ASIR-V algorithms at different radiation doses
图 2 在不同辐射剂量下,DLIR与ASIR-V算法重建图像的测量值趋势图Figure 2. Trend of measured values of reconstructed images by DLIR and ASIR-V algorithms at different radiation doses2.3 DLIR与ASIR-V重建图像的量化分析
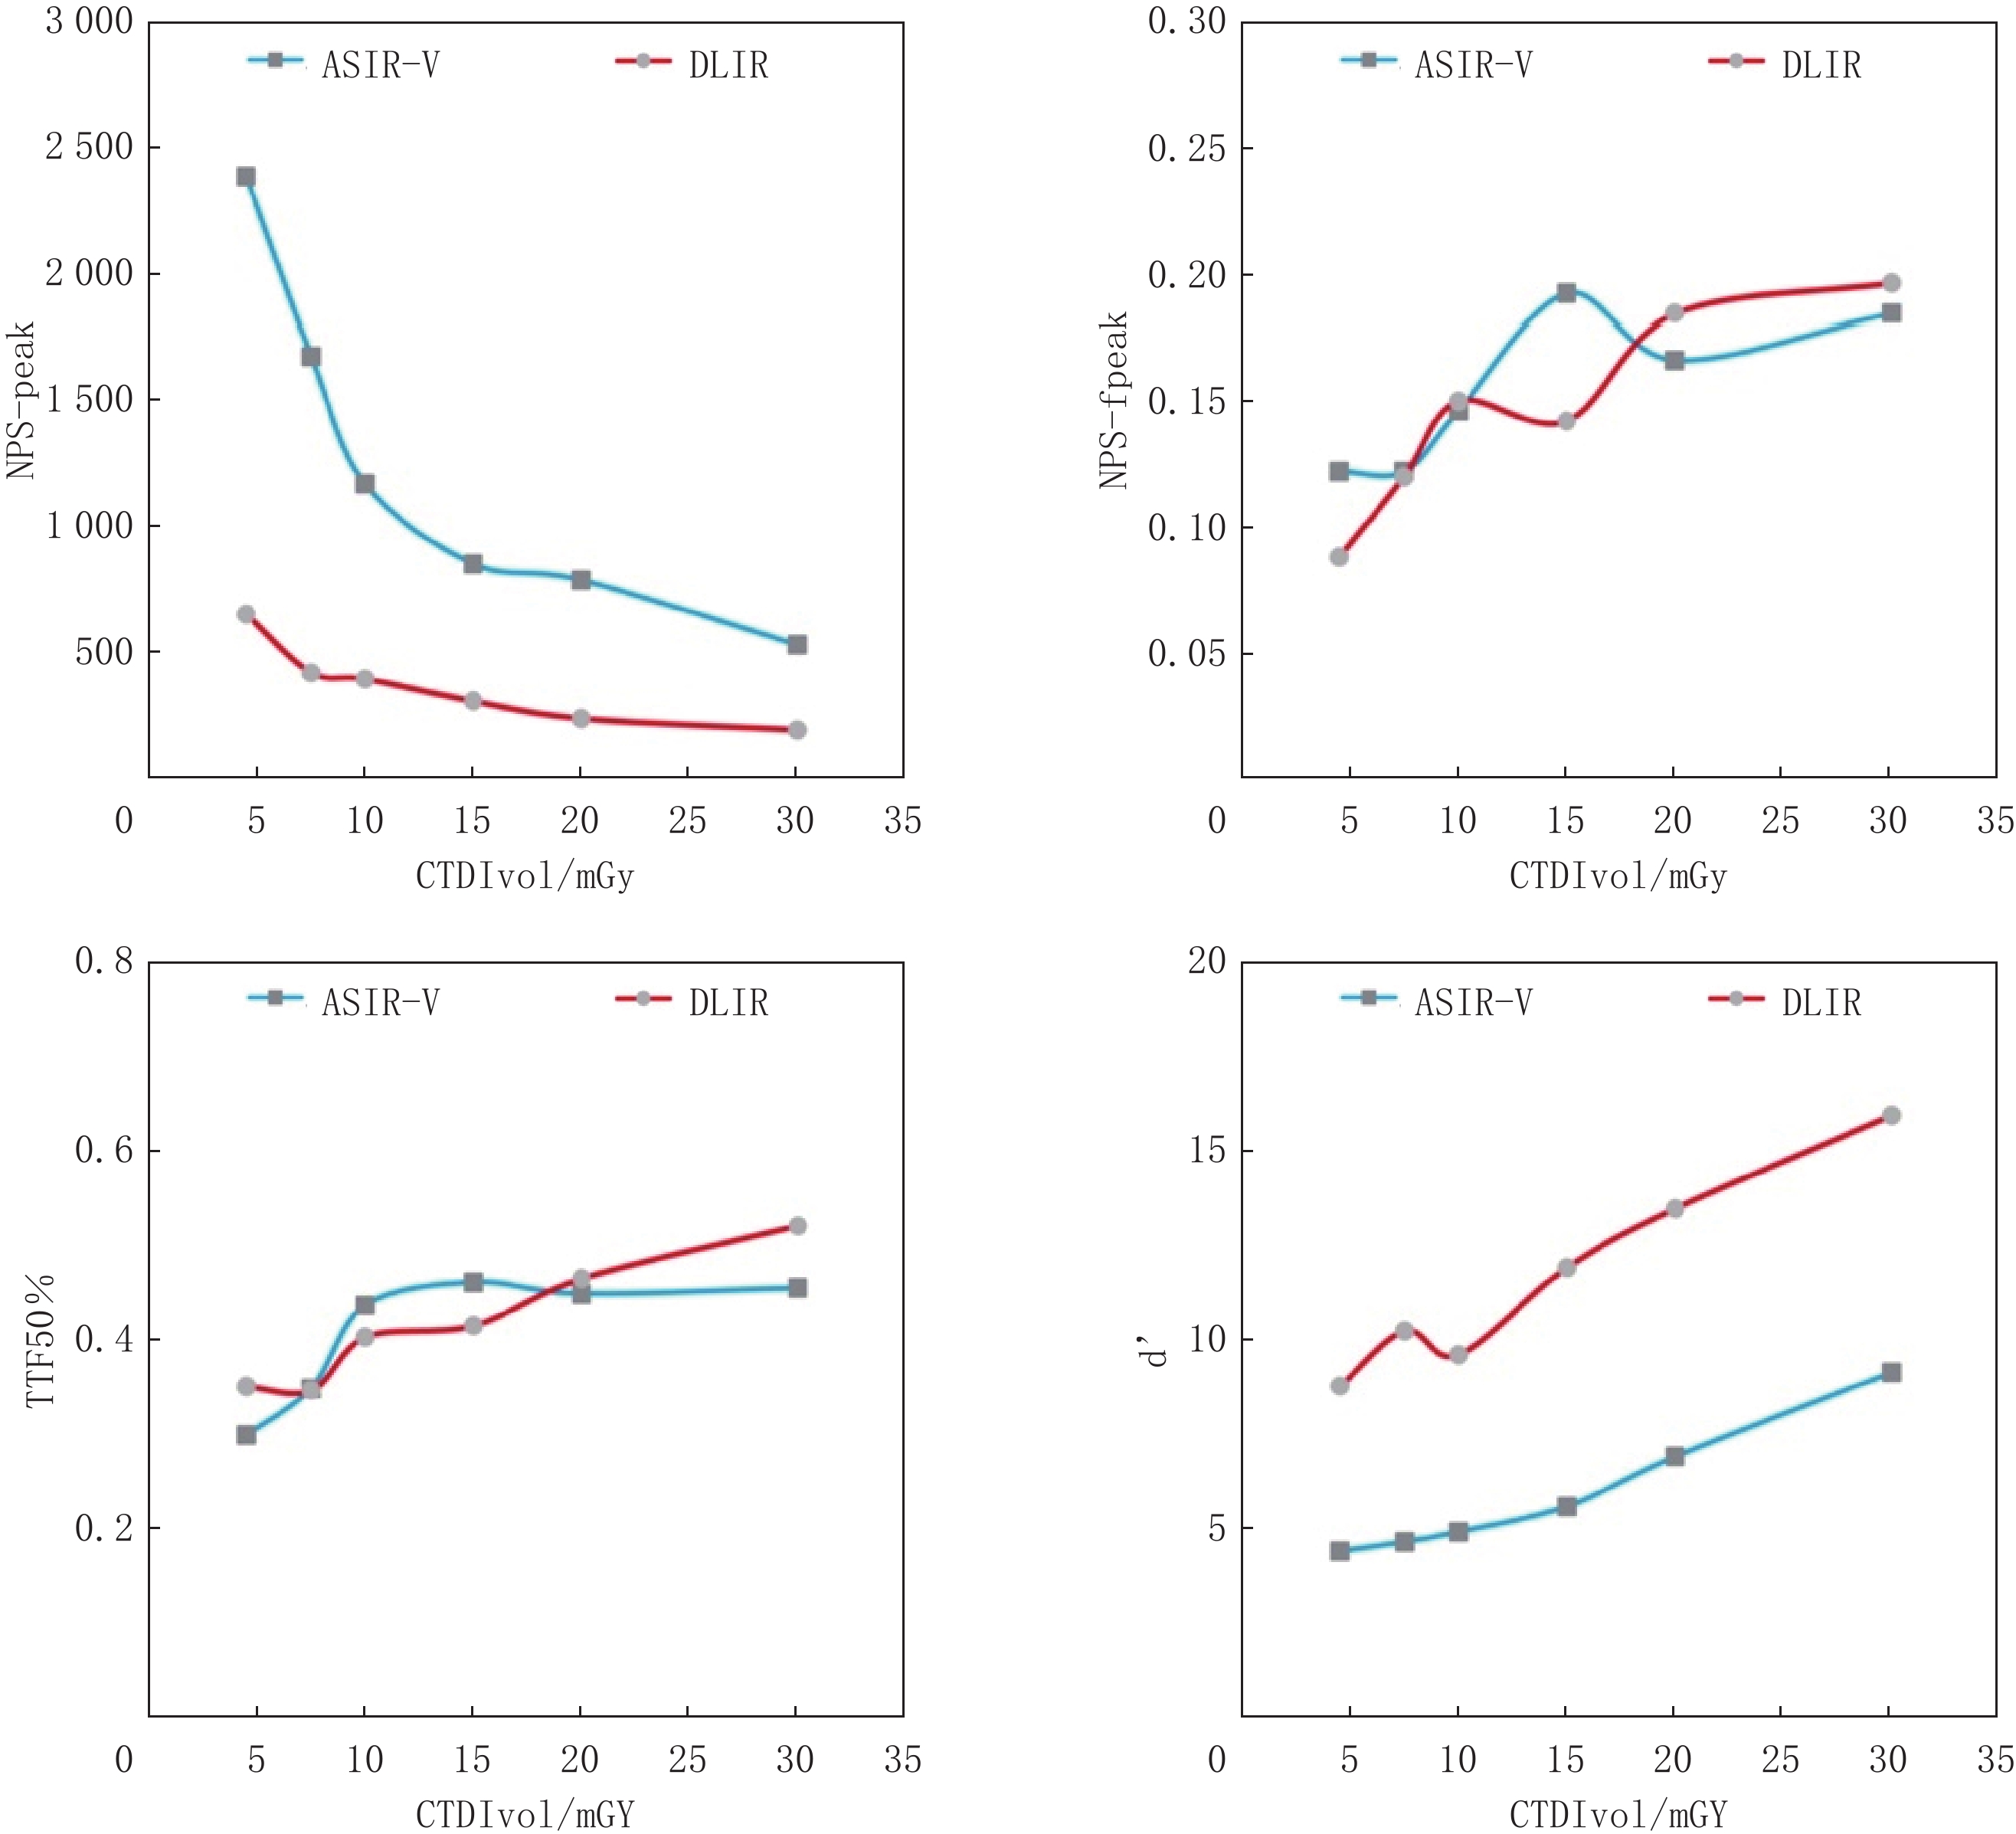
表3展示在不同剂量辐射下,两种算法重建图像的NPS-peak、NPS-fpeak、TTF50%和d’的平均值及标准差。图3描绘这些指标随辐射剂量变化的曲线。观察曲线可知,NPS-peak随着辐射剂量的增加呈下降趋势。在任一剂量下,DLIR的NPS-peak均显著大于ASIR-V(P<0.001)。对于NPS-fpeak,其值随着放射剂量的升高而增加。具体来说,在20 mGy和30 mGy的剂量下,DLIR的NPS-fpeak值大于ASIR-V;在7.5 mGy和10 mGy的剂量下,两者值相等;而在4.5 mGy和15 mGy的剂量下,DLIR的值小于ASIR-V的值(P=0.379)。TTF50%随着辐射剂量的增加呈现上升趋势。在4.5、20和30 mGy的剂量下,DLIR的NPS-fpeak值大于ASIR-V;在7.5 mGy的剂量下,两者值相等;在10 mGy和15 mGy剂量下,DLIR的值小于ASIR-V(P=0.61)。此外,
$d' $ 的值随着辐射剂量的增加而升高。在所有剂量水平上,DLIR的$d' $ 值均显著超过ASIR-V(P<0.001)。表 3 在不同辐射剂量下,DLIR与ASIR-V算法重建图像的量化分析比较Table 3. Comparison of quantitative analysis of reconstructed images by DLIR and ASIR-V algorithms at different radiation dosesCTDIvol/mGy NPS-peak(P<0.001) NPS-fpeak(P=0.379) TTF50%(P=0.61) $d' $(P<0.001) DLIR ASIR-V DLIR ASIR-V DLIR ASIR-V DLIR ASIR-V 30 189.02±34.5 528.47±75.13 0.2±0.07 0.18±0.06 0.52±0.13 0.46±0.08 15.95±2.64 9.16±1.43 20 234.72±6.99 786.15±119.99 0.18±0.06 0.17±0.04 0.47±0.06 0.45±0.05 13.49±1.18 6.93±1.09 15 303.35±25.14 850.79±78.38 0.14±0.07 0.19±0.07 0.42±0.02 0.46±0.06 11.94±2.09 5.61±1.28 10 391.89±36.38 1168.32 ±84.180.15±0.05 0.15±0.04 0.4±0.02 0.44±0.11 9.64±0.72 4.94±0.64 7.5 418.12±63.66 1674.62 ±316.680.12±0.05 0.12±0.03 0.35±0.06 0.35±0.04 10.26±1.84 4.68±0.95 4.5 650.8±151.44 2385.55 ±474.440.09±0.02 0.12±0.04 0.35±0.04 0.3±0.06 8.81±0.63 4.43±0.4 ![]() 图 3 在不同辐射剂量下,DLIR与ASIR-V算法重建图像的量化Figure 3. Quantitative trend of reconstructed images by DLIR and ASIR-V algorithms at different radiation doses
图 3 在不同辐射剂量下,DLIR与ASIR-V算法重建图像的量化Figure 3. Quantitative trend of reconstructed images by DLIR and ASIR-V algorithms at different radiation doses综上所述,DLIR和ASIR-V在不同辐射剂量下的图像重建性能存在差异,这些差异反映了两种算法在不同辐射剂量条件下对图像细节的捕捉能力和整体图像质量的处理效果。
2.4 DLIR与ASIR-V重建图像的Bland-Altman分析
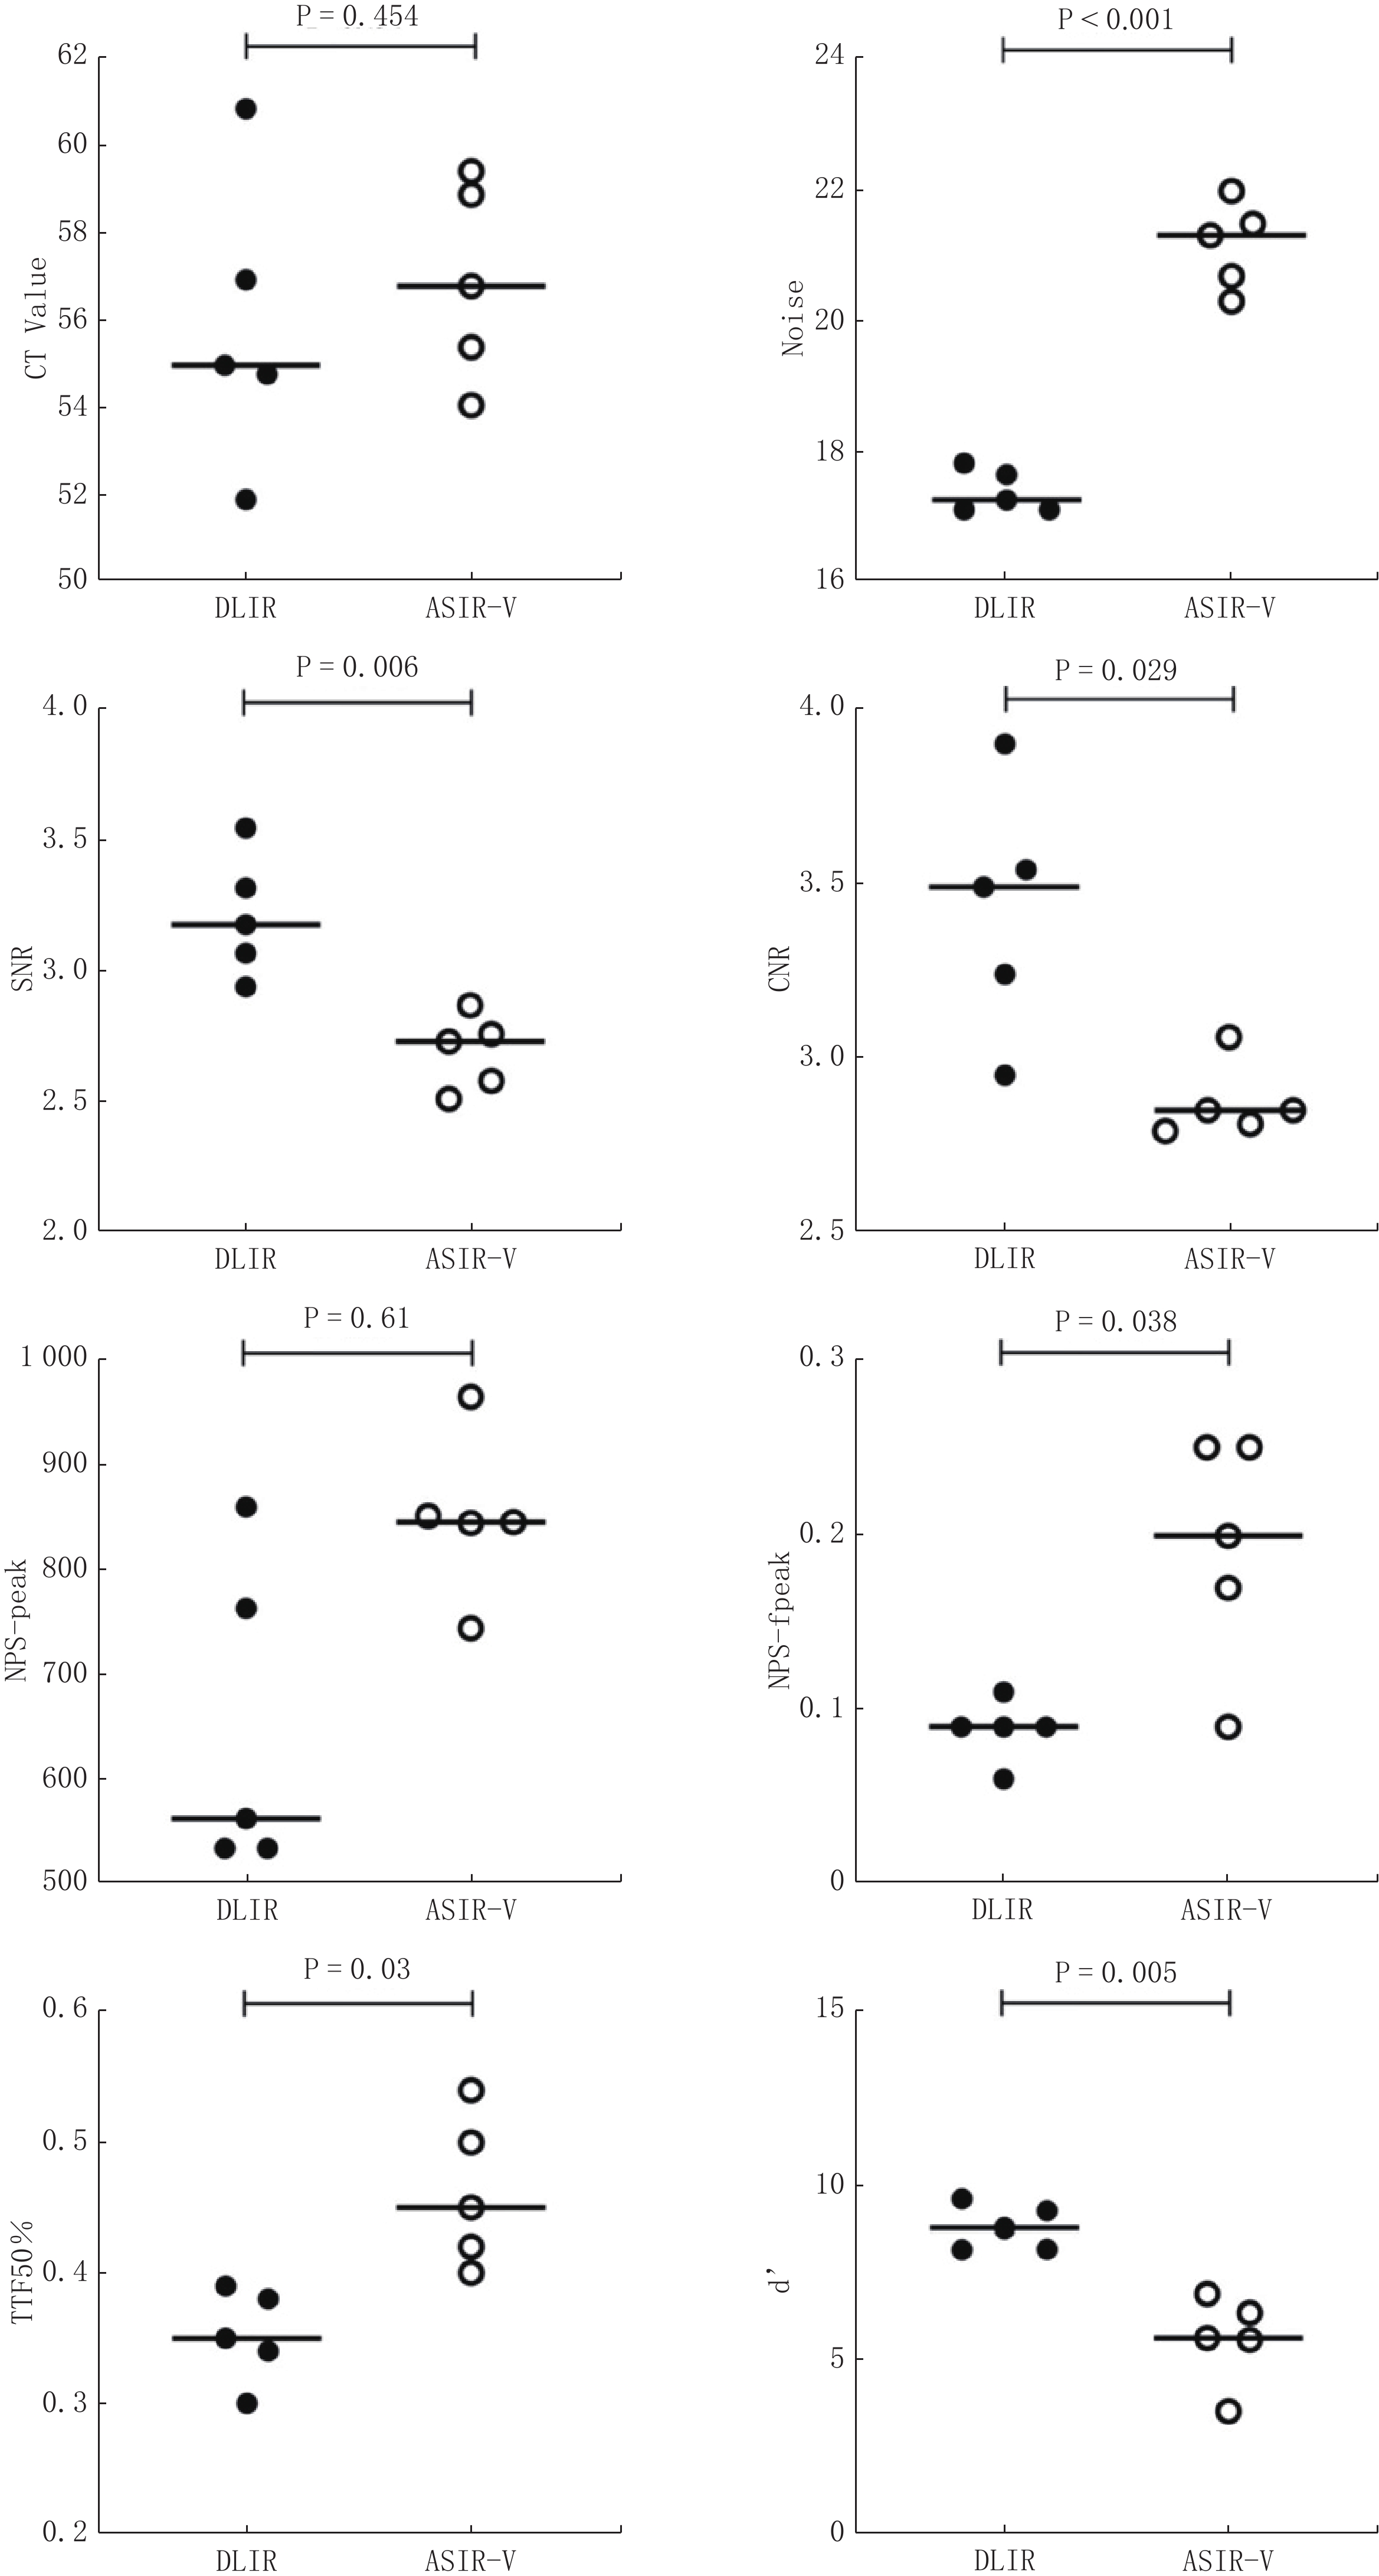
经过Bland-Altman差异性分析(表4和图4),与常用的15 mGy剂量下的ASIR-V重建扫描比较,我们发现DLIR在4.5 mGy的辐射剂量下表现出显著的优势。具体来说,DLIR的噪声水平平均下降3.758(95% CI:-5.231,-2.285)(P<0.001),这意味着其图像具有更低的噪声水平。此外,DLIR的SNR提高0.522(0.090,0.954)(P=0.006),CNR上升0.552(0.171,1.274)(P=0.029)。最后,DLIR的可检测度指数(d’)提高3.198(0.638,5.758)(P=0.005)。以上结果表明DLIR的图像质量显著优于ASIR-V。
表 4 4.5 mGy剂量下的DLIR图像质量测量值与15 mGy剂量下的ASIR-V图像质量测量值差异性的Bland-Altman分析Table 4. Bland–Altman analysis of the difference in image quality measurements between DLIR (4.5 mGy) and ASIR-V (15 mGy)指标 DLIR vs ASIR-V平均值(95%置信区间) CT Value -1.026(-6.450~4.398) Noise -3.758(-5.231~-2.285) SNR 0.522(0.090~0.954) CNR 0.552(0.171~1.274) NPS-peak -200.0(-398.3~-1.681) NPS-fpeak -0.104(-0.254~ 0.0457 )TTF50% -0.110(-0.256~0.036) d’ 3.198(0.638~5.758) ![]() 图 4 4.5 mGy剂量下的DLIR图像质量测量值与15 mGy剂量下的ASIR-V图像质量测量值差异性的Bland- Altman散点图Figure 4. Bland–Altman scatter plots of the difference in image quality measurements between DLIR (4.5 mGy) and ASIR-V (15 mGy)
图 4 4.5 mGy剂量下的DLIR图像质量测量值与15 mGy剂量下的ASIR-V图像质量测量值差异性的Bland- Altman散点图Figure 4. Bland–Altman scatter plots of the difference in image quality measurements between DLIR (4.5 mGy) and ASIR-V (15 mGy)3. 讨论
经过6种不同辐射剂量下的体模扫描和图像质量评价实验,结果显示,DLIR重建图像的质量均优于ASIR-V重建。特别值得关注的是,在辐射剂量仅为4.5 mGy的情况下,DLIR的图像质量已达到相当于15 mGy ASIR-V的水平。这一发现对于优化放射影像学的图像质量和降低患者接受的辐射剂量具有重要的实际意义。
在CT肝脏扫描领域,为了在减少辐射剂量的同时保证图像质量,目前广泛采用迭代重建技术[17-18]。尽管迭代重建技术在正常剂量和低剂量CT图像中取得了显著成效,但在处理超低剂量CT图像时,由于其噪声较大,可能会导致图像出现“斑片感”和“蜡像感”,从而影响肝脏病变诊断的准确性[9]。Mileto等[19]指出,迭代重建算法在腹部病灶成像方面,仍存在噪声纹理不自然,进而影响放射医生诊断的问题。近年来出现了基于深度学习的DLIR算法,其主要目标是在保留图像纹理细节的同时降低噪声干扰[20]。Cao等[21]通过临床实验证明在肝脏病灶的增强CT扫描中,DLIR相比于ASIR-V在减少76%辐射剂量的同时,获得更优秀的CNR和诊断置信度。本实验通过扫描标准体模,定量探究DLIR和ASIR-V在重建后,图像质量方面各个参数上的差异,进一步证明在标准肝脏密度扫描中,DLIR相比于ASIR-V的优越性。
本研究的结果表明,在降噪、提高信噪比和对比噪声比方面,DLIR算法的表现优于ASIR-V。在不同辐射剂量下,DLIR和ASIR-V之间的CT值没有显著差异。值得注意的是,随着辐射剂量的增加,两种算法之间的CT值差异逐渐减小。此外,DLIR和ASIR-V的测量结果均显示,随着剂量的增加,噪声逐渐降低,并且DLIR始终低于ASIR-V(P<0.001)。同时,SNR和CNR逐渐提高,DLIR在这方面始终优于ASIR-V(P<0.001)。van STIPHOUT等[4]的系统性综述通过总结16篇论著,也证明在腹部CT扫描中,测量CT值时DLIR和IR无明显不同,测量SNR和CNR时DLIR显著优于ASIR-V。
在图像的量化方面,随着剂量的增加,DLIR和ASIR-V两种算法处理下的NPS-peak均呈下降趋势,其中DLIR的降低幅度显著大于ASIR-V(P<0.001)。然而,尽管两种算法处理下的NPS-fpeak(P=0.379)和TTF 50%(P=0.61)随剂量增加均呈上升趋势,但二者并未达到统计学上的显著差异。此外,随着剂量的增加,d’在DLIR和ASIR-V两种算法下均有所增加,其中DLIR的增加幅度显著超过了ASIR-V(P<0.001)。这与Greffier等[8,22]实验研究结果相一致,其通过两次体模实验证明了在增加辐射剂量的条件下,采用ASIR-V算法得到的所有NPS-peak值均高于DLIR,同时ASIR-V获得的所有d’值也均低于DLIR。
本研究证实了DLIR在降噪方面的优势,相较于ASIR-V,DLIR在同是15 mGy的辐射剂量下能降低噪声64%,SNR增加64%,CNR增加36%,NPS-peak减少64%,其d’值更是ASIR-V的两倍。即使在实验测得的最小剂量4.5 mGy条件下,相较于15 mGy的ASIR-V,DLIR噪声仍下降18%,SNR提高19%,CNR提高19%,NPS-peak下降24%,其d’值仍然是ASIR-V的1.6倍。DLIR能够在低对比度下优化肝脏病变的图像质量,比ASIR-V优化能力更强。在本研究中,我们针对上腹部CT扫描的典型临床应用,进行参数设置,其他研究发现即使在参数设置不同的情况下,DLIR相比于ASIR-V在图像优化能力上仍然表现更优秀[14,23]。尽管如此,DLIR在肝脏病变扫描中仍存在潜在不足,Jensen等[24]提出,DLIR可能对小于0.5 cm的肝脏病灶和血管的检测图像造成模糊,并且其识别微小结构的能力可能有限,而这在肝脏病变诊断中尤为重要。本研究在图像重建方面采用了ASIR-V与DLIR两种方法。ASIR-V作为一种迭代重建技术的代表,而DLIR则代表了深度学习重建技术。尽管这两种特定的命名方式源于某品牌设备,但其他品牌设备亦存在类似技术,只是命名上有所差异[22,25-27]。本研究中从特定角度展现了深度学习图像重建在提升图像质量方面的优势。尽管难以涵盖所有设备,但其仍具备一定的代表性。
本研究存在一些局限性。①在实验设计上,本研究对实验参数的设定相对有限,仅限于特定的电压和层厚。根据Ja等[4]的研究,层厚的选择可能会直接影响信噪比和对比噪声比的测量结果,以及诊断的置信度。②本研究采用的所有算法均来自同一制造商。Greffier等[22]通过比较不同CT供应商的迭代算法,证明不同制造商提供的算法可能会导致研究结果出现差异。③本研究设置的辐射剂量范围还不够大,未来需要扩大范围做进一步研究。以上这些因素可能对本研究结果产生一定的影响。④本实验扫描的是体模下的标准肝脏密度(1.06 g/cm3),未来我们将把本实验的结论和数据应用于不同碘密度及真实患者的CT扫描中,以此为将来的研究奠定基础。
综上所述,在模拟标准肝脏密度的局灶性病变体模CT扫描实验中,DLIR相较于ASIR-V,不仅显著提升了SNR,CNR和
$d' $ 值,而且大幅度降低了图像噪声,进而优化了图像的空间分辨率和整体质量。实验数据表明,DLIR技术能够在4.5 mGy的较低辐射剂量下,实现优于常规15 mGy剂量下ASIR-V重建图像的质量效果。这一发现为腹部CT增强扫描提供了新的可能性,即采用4.5 mGy的扫描剂量配合DLIR重建技术,有望在保障图像质量的同时,降低患者接受的辐射剂量。 -
![]()
图 1 Gammex CT体模的照片,箭头所指是代表标准肝脏密度(1.06 g/cm3)的插入物
Figure 1. Image of the Gammex CT phantom shows an insert that represents liver density (1.06 g/cm3) (arrow)
![]()
图 2 在不同辐射剂量下,DLIR与ASIR-V算法重建图像的测量值趋势图
Figure 2. Trend of measured values of reconstructed images by DLIR and ASIR-V algorithms at different radiation doses
![]()
图 3 在不同辐射剂量下,DLIR与ASIR-V算法重建图像的量化
Figure 3. Quantitative trend of reconstructed images by DLIR and ASIR-V algorithms at different radiation doses
![]()
图 4 4.5 mGy剂量下的DLIR图像质量测量值与15 mGy剂量下的ASIR-V图像质量测量值差异性的Bland- Altman散点图
Figure 4. Bland–Altman scatter plots of the difference in image quality measurements between DLIR (4.5 mGy) and ASIR-V (15 mGy)
表 1 CT设备的参数
Table 1 Parameters of CT Equipment
变量 参数 管电压 120 kVp 层厚 1.25 mm 辐射剂量 CTDIvol 30、20、15、10、7.5、4.5 mGy 视野 30.0 cm×30.0 cm 重建图像矩阵 512×512 重建算法 ASIR-V-50%,DLIR-H  下载: 导出CSV
表 2 在不同辐射剂量下,DLIR与ASIR-V算法重建图像的测量值比较
Table 2 Comparison of measurements of reconstructed images by DLIR and ASIR-V algorithms at different radiation doses
CTDIvol/mGy CT value(P=0.001) Noise(P<0.001) SNR(P<0.001) CNR(P<0.001) DLIR ASIR-V DLIR ASIR-V DLIR ASIR-V DLIR ASIR-V 30 62.66±3.17 62.06±3.55 11.12±0.69 17.19±1.05 5.65±0.38 3.62±0.19 5.3±0.12 3.69±0.15 20 55.91±2.08 57.58±2.81 12.15±0.34 19.39±0.33 4.61±0.22 2.97±0.15 4.09±0.26 3.2±0.17 15 55.94±1.7 56.91±2.27 13.66±0.55 21.17±0.67 4.1±0.16 2.69±0.14 3.89±0.26 2.87±0.11 10 55.74±2.18 57.71±3.17 15.18±0.3 24.19±1.06 3.67±0.1 2.39±0.17 3.83±0.33 2.63±0.27 7.5 55.35±2.32 59.86±3.34 15.79±0.57 26.37±1.5 3.51±0.2 2.28±0.24 3.78±0.14 2.44±0.17 4.5 55.88±3.31 59.94±4.77 17.41±0.32 29.33±0.91 3.21±0.24 2.05±0.2 3.42±0.35 2.18±0.3
下载: 导出CSV
表 3 在不同辐射剂量下,DLIR与ASIR-V算法重建图像的量化分析比较
Table 3 Comparison of quantitative analysis of reconstructed images by DLIR and ASIR-V algorithms at different radiation doses
CTDIvol/mGy NPS-peak(P<0.001) NPS-fpeak(P=0.379) TTF50%(P=0.61) $d' $(P<0.001) DLIR ASIR-V DLIR ASIR-V DLIR ASIR-V DLIR ASIR-V 30 189.02±34.5 528.47±75.13 0.2±0.07 0.18±0.06 0.52±0.13 0.46±0.08 15.95±2.64 9.16±1.43 20 234.72±6.99 786.15±119.99 0.18±0.06 0.17±0.04 0.47±0.06 0.45±0.05 13.49±1.18 6.93±1.09 15 303.35±25.14 850.79±78.38 0.14±0.07 0.19±0.07 0.42±0.02 0.46±0.06 11.94±2.09 5.61±1.28 10 391.89±36.38 1168.32 ±84.180.15±0.05 0.15±0.04 0.4±0.02 0.44±0.11 9.64±0.72 4.94±0.64 7.5 418.12±63.66 1674.62 ±316.680.12±0.05 0.12±0.03 0.35±0.06 0.35±0.04 10.26±1.84 4.68±0.95 4.5 650.8±151.44 2385.55 ±474.440.09±0.02 0.12±0.04 0.35±0.04 0.3±0.06 8.81±0.63 4.43±0.4
下载: 导出CSV
表 4 4.5 mGy剂量下的DLIR图像质量测量值与15 mGy剂量下的ASIR-V图像质量测量值差异性的Bland-Altman分析
Table 4 Bland–Altman analysis of the difference in image quality measurements between DLIR (4.5 mGy) and ASIR-V (15 mGy)
指标 DLIR vs ASIR-V平均值(95%置信区间) CT Value -1.026(-6.450~4.398) Noise -3.758(-5.231~-2.285) SNR 0.522(0.090~0.954) CNR 0.552(0.171~1.274) NPS-peak -200.0(-398.3~-1.681) NPS-fpeak -0.104(-0.254~ 0.0457 )TTF50% -0.110(-0.256~0.036) d’ 3.198(0.638~5.758)
下载: 导出CSV
-
[1] MARRERO J A, AHN J, RAJENDER REDDY K, et al. ACG clinical guideline: The diagnosis and management of focal liver lesions[J]. The American Journal of Gastroenterology, 2014, 109(9): 1328−1347,1348. DOI: 10.1038/ajg.2014.213.
[2] CHOI H, CHANG W, KIM J H, et al. Dose reduction potential of vendor-agnostic deep learning model in comparison with deep learning-based image reconstruction algorithm on CT: A phantom study[J]. European Radiology, 2022, 32(2): 1247−1255. DOI: 10.1007/s00330-021-08199-9.
[3] LEE H J, KIM J S, LEE J K, et al. Ultra-low-dose hepatic multiphase CT using deep learning-based image reconstruction algorithm focused on arterial phase in chronic liver disease: A non-inferiority study[J]. European Journal of Radiology, 2023, 159: 110659. DOI: 10.1016/j.ejrad.2022.110659.
[4] van STIPHOUT J A, DRIESSEN J, KOETZIER L R, et al. The effect of deep learning reconstruction on abdominal CT densitometry and image quality: S systematic review and meta-analysis[J/OL]. European Radiology, 2022, 32(5). [2023-12-27]. https://pubmed.ncbi.nlm.nih.gov/34913104/. DOI: 10.1007/s00330-021-08438-z.
[5] GREFFIER J, PEREIRA F, MACRI F, et al. CT dose reduction using automatic exposure control and iterative reconstruction: A chest paediatric phantoms study[J]. Physica Medica: PM: An International Journal Devoted to the Applications of Physics to Medicine and Biology: Official Journal of the Italian Association of Biomedical Physics (AIFB), 2016, 32(4): 582−589. DOI: 10.1016/j.ejmp.2016.03.007.
[6] CHEN L H, JIN C, LI J Y, et al. Image quality comparison of two adaptive statistical iterative reconstruction (asir, asir-v) algorithms and filtered back projection in routine liver CT[J]. The British Journal of Radiology, 2018, 91(1088): 20170655. DOI: 10.1259/bjr.20170655.
[7] GEYER L, SCHOEPF U J, MEINEL F G, et al. State of the art: Iterative ct reconstruction techniques[J]. Radiology, 2015, 276(2): 339−357. DOI: 10.1148/radiol.2015132766.
[8] GREFFIER J, HAMARD A, PEREIRA F, et al. Image quality and dose reduction opportunity of deep learning image reconstruction algorithm for CT: A phantom study[J]. European Radiology, 2020, 30(7): 3951−3959. DOI: 10.1007/s00330-020-06724-w.
[9] KOETZIER L R, MASTRODICASA D, SZCZYKUTOWICZ T P, et al. Deep learning image reconstruction for CT: Technical principles and clinical prospects[J]. Radiology, 2023, 306(3): e221257. DOI: 10.1148/radiol.221257.
[10] SZCZYKUTOWICZ T P, NETT B, CHERKEZYAN L, et al. Protocol optimization considerations for implementing deep learning CT reconstruction[J]. American Journal of Roentgenology, 2021, 216(6): 1668−1677. DOI: 10.2214/AJR.20.23397.
[11] MOHAMMADINEJAD P, MILETO A, YU L, et al. CT noise-reduction methods for lower-dose scanning: Strengths and weaknesses of iterative reconstruction algorithms and new techniques[J]. Radiographics: A Review Publication of the Radiological Society of North America, Inc, 2021, 41(5): 1493−1508. DOI: 10.1148/rg.2021200196.
[12] JENSEN C T, GUPTA S, SALEH M, et al. Reduced-dose deep learning reconstruction for abdominal CT of liver metastases[J]. Radiology, 2022, 303(1): 90−98. DOI: 10.1148/radiol.211838.
[13] KANAL K M, BUTLER P F, SENGUPTA D, et al. U. S. diagnostic reference levels and achievable doses for 10 adult ct examinations[J]. Radiology, 2017, 284(1): 120−133. DOI: 10.1148/radiol.2017161911.
[14] ZHONG J, XIA Y, CHEN Y, et al. Deep learning image reconstruction algorithm reduces image noise while alters radiomics features in dual-energy CT in comparison with conventional iterative reconstruction algorithms: A phantom study[J]. European Radiology, 2022, 33(2): 812−824. DOI: 10.1007/s00330-022-09119-1.
[15] TSURUSAKI M, SOFUE K, HORI M, et al. Dual-energy computed tomography of the liver: Uses in clinical practices and applications[J]. Diagnostics (Basel, Switzerland), 2021, 11(2): 161. DOI: 10.3390/diagnostics11020161.
[16] SAMEI E, BAKALYAR D, BOEDEKER K L, et al. Performance evaluation of computed tomography systems: Summary of aapm task group 233[J]. Medical Physics, 2019, 46(11): e735−e756. DOI: 10.1002/mp.13763.
[17] HAN W K, NA J C, PARK S Y. Low-dose ct angiography using asir-v for potential living renal donors: A prospective analysis of image quality and diagnostic accuracy[J]. European Radiology, 2020, 30(2): 798−805. DOI: 10.1007/s00330-019-06423-1.
[18] LARBI A, ORLIAC C, FRANDON J, et al. Detection and characterization of focal liver lesions with ultra-low dose computed tomography in neoplastic patients[J]. Diagnostic and Interventional Imaging, 2018, 99(5): 311−320. DOI: 10.1016/j.diii.2017.11.003.
[19] MILETO A, GUIMARAES L S, MCCOLLOUGH C H, et al. State of the art in abdominal CT: The limits of iterative reconstruction algorithms[J]. Radiology, 2019, 293(3): 491−503. DOI: 10.1148/radiol.2019191422.
[20] HSIEH J, LIU E, NETT B, et al. A new era of image reconstruction: TruefidelityTM. technical white paper on deep learning image reconstruction[J/OL]. gehealthcare. com, 2019.
[21] CAO L, LIU X, LI J, et al. A study of using a deep learning image reconstruction to improve the image quality of extremely low-dose contrast-enhanced abdominal CT for patients with hepatic lesions[J]. The British Journal of Radiology, 2021, 94(1118): 20201086. DOI: 10.1259/bjr.20201086.
[22] GREFFIER J, FRANDON J, LARBI A, et al. CT iterative reconstruction algorithms: A task-based image quality assessment[J]. European Radiology, 2020, 30(1): 487−500. DOI: 10.1007/s00330-019-06359-6.
[23] CARUSO D, DE SANTIS D, DEL GAUDIO A, et al. Low-dose liver CT: Image quality and diagnostic accuracy of deep learning image reconstruction algorithm[J]. European Radiology, 2023, 34(4): 2384−2393. DOI: 10.1007/s00330-023-10171-8.
[24] JENSEN C T, LIU X, TAMM E P, et al. Image quality assessment of abdominal CT by use of new deep learning image reconstruction: Initial experience[J]. American Journal of Roentgenology, 2020, 215(1): 50−57. DOI: 10.2214/AJR.19.22332.
[25] CHEN Y, ZHONG J, WANG L, et al. Multivendor comparison of quantification accuracy of iodine concentration and attenuation measurements by dual-energy CT: A phantom study[J]. American Journal of Roentgenology, 2022, 219(5): 827−839. DOI: 10.2214/AJR.22.27753.
[26] SINGH R, DIGUMARTHY S R, MUSE V V, et al. Image quality and lesion detection on deep learning reconstruction and iterative reconstruction of submillisievert chest and abdominal CT[J/OL]. American Journal of Roentgenology, 2020. [2024-06-25]. DOI: 10.2214/AJR.19.21809.
[27] NAM J G, AHN C, CHOI H, et al. Image quality of ultralow-dose chest CT using deep learning techniques: Potential superiority of vendor-agnostic post-processing over vendor-specific techniques[J]. European Radiology, 2021, 31(7): 5139−5147. DOI: 10.1007/s00330-020-07537-7.


计量
- 文章访问数: 97
- HTML全文浏览量: 17
- PDF下载量: 14