Diagnostic Efficacy of Quantitative Computed Tomography in CTD-ILA/ILD
-
摘要:
目的:本研究旨在探讨定量CT在结缔组织病相关间质性肺异常(CTD-ILA)和间质性肺疾病(CTD-ILD)中的诊断效能,建立基于定量CT的CTD患者筛查方法。方法:纳入CTD-ILD患者140例、CTD-ILA患者33例及对照组109例,使用3D-Slicer获得定量指标。结果:各组间定量CT指标均存在差异。ROC分析显示,F%、GGO%、SD及Kurtosis是鉴别对照组与CTD-ILA/ILD的敏感指标,其中SD在早期诊断CTD-ILA(AUC=0.862)、CTD-ILD(AUC=0.923)时表现最佳,进一步区分CTD-ILA与CTD-ILD时,SD(AUC=0.649)和F%(AUC=0.617)展现出较强区分能力。多元逐步logistic回归分析显示,F%、GGO%、SD和Kurtosis在区分对照组与CTD-ILA/ILD时具有统计学意义。结论:定量CT对于CTD-ILA/ILD早期诊断具有重要意义,基于定量CT构建CTD筛查流程有助实现患者精准管理。
Abstract:Objective: The aim of this study is to evaluate the diagnostic efficacy of quantitative computed tomography (CT) in differentiating between connective tissue disease-associated interstitial lung abnormalities (CTD-ILA) and connective tissue disease-associated interstitial lung disease (CTD-ILD), as well as to establish a screening protocol for connective tissue disease (CTD) patients based on quantitative CT. Methods: A total of 140 patients with CTD-ILD, 33 patients with CTD-ILA, and 109 healthy controls were enrolled. Quantitative indices were obtained using the 3D-Slicer software. Results: Significant differences in quantitative CT indices are observed among the groups (p < 0.05). ROC analysis shows that the F%, GGO%, SD, and kurtosis are sensitive indicators for differentiating the control group from those with CTD-ILA/ILD. Notably, the best SD is demonstrated in the early diagnosis of both the CTD-ILA (AUC = 0.862) and CTD-ILD (AUC = 0.923) groups. Further distinguishing between CTD-ILA and CTD-ILD shows the strong discriminatory ability of the SD (AUC = 0.649) and F% (AUC = 0.617). Multivariable stepwise logistic regression analysis shows that F%, GGO%, SD, and kurtosis are statistically significant in differentiating the control group from the CTD-ILA/ILD groups (p < 0.05). Conclusion: Quantitative CT is promising for the early diagnosis of CTD-ILA/ILD. Establishing a CTD screening protocol based on quantitative CT can facilitate precise patient management.
-
双能量CT(dual-energy computed tomography, DECT)作为一种较为先进的成像技术,已广泛应用于临床实践。DECT利用物质在不同X射线能量下的衰减特性,获取高能量和低能量图像数据,从而实现单能量成像、物质成分分离和定量分析[1-3]。
在物质的定量分析中,电子密度(electron density, ED)ρe和有效原子序数(effective atomic number, EAN)Zeff不仅用于结石成分分类和肿瘤良恶性鉴别,还被用于放射治疗的蒙特卡洛剂量估算和放疗后放射性肺炎的分级评估[4-9]。因此,准确测量ρe和Zeff是实现精准影像诊断和精确剂量估算的基础。虽然已有一些研究探讨了在DECT中测量ρe和Zeff的准确性,但由于使用的CT机型(双能量成像模式)、扫描和重建参数等存在差异,导致这些研究结果难以进行比较。
本文综述近年来相关的文献研究,分析影响ρe和Zeff测量准确性的关键因素,探讨提高这些参数测量精度的方法,旨在提高影像诊断和治疗的精确性。
1. ρe和Zeff的影响因素
常规CT图像的生成是基于不同物质对X射线的衰减程度的差异,这些差异通常用衰减系数μ来量化,并以Hounsfield单位(HU)表示。因此在临床实践中,组织的HU值可能会因光子能量和扫描参数的变化而发生改变。此外,不同的组织也会表现出相同的HU值,这种现象源于衰减系数μ不仅受到光子能量的影响,还与组织密度和元素组成密切相关。1976年,Rutherford 等[10]提出利用不同能量的X射线对同一解剖结构进行至少两次扫描,以获取不同能量下的图像,进而推导出衰减系数μ与ρe和Zeff之间的关系。
目前,双能量成像作为主流的能谱CT技术,其X射线能量的解析方法会间接影响ρe和Zeff的计算结果。能量解析主要有两种方法:基于投影数据域的解析和基于图像域的解析[11]。前者通过减少射线束硬化效应,提高了解析的准确性,但计算过程更为复杂且对噪声更加敏感;后者则在计算简便性和对噪声的抗干扰能力上具有优势[12]。总之,射线束硬化效应和噪声都可能对物质的衰减系数μ造成干扰,进而影响对组织ρe和Zeff的测量精度。
1.1 射线束硬化效应的影响
CT系统采用多色能谱X射线技术,在X射线穿透介质的过程中,大量低能X射线被吸收衰减,而高能X射线的衰减相对较少,导致透射线束中的高能X射线比例提高,出现“射线束硬化”的现象[13]。在这过程中,衰减系数μ发生了变化。然而,在图像重建过程中,通常假设X射线能谱为单色,即认为衰减系数μ是恒定不变的。这种假设会导致实际的衰减系数μ与假定值之间出现偏差,进而影响到ρe和Zeff的测量精度。
随着被测物体体积的增大,射线束硬化效应变得更加显著,这将导致ρe和Zeff的测量误差进一步增大。Schaeffer等[14]在研究中指出,在较小尺寸的头部模型中,ρe和Zeff的测量值比在较大尺寸的体部模型中更为精确。然而,Almeida等[15]的研究结果与之不同,在两种不同尺寸的模型中,ρe和Zeff的测量值并无显著差异,这可能源于事先使用模体进行了ρe和Zeff的校准,有效地校正了射线束硬化效应。值得注意的是,尽管Hua等[16]没有使用模体进行校准,但他们的研究结果与Almeida等[15]相似,发现两种尺寸模型中ρe和Zeff的测量值差异控制在0.7% 和2% 以内。这可能与他们使用的双层探测器CT技术有关,该技术能够实现基于投影数据的材料分解,有效减轻射线束硬化的影响。
除体型尺寸外,扫描中心的偏移也是影响射线束硬化效应的一个重要因素。Schaeffer等[14]发现,当模体在上下左右4个方向上发生偏移时,Zeff会有 3% 的变化,而ρe则相对不敏感。尽管Zeff的变化幅度不大,但这足以对物质的鉴别造成影响。例如,在偏离等中心点的模体中,血液等效组织插件(40 HU)的Zeff与未发生偏移模体中的水等效组织插件的Zeff相近。由于扫描位置受到受检者特异性及摆位技师判断偏倚的影响,难以通过其他方法进行校正,因此,制定标准化的摆位流程对于提高ρe和Zeff测量的准确性至关重要。
1.2 噪声的影响
噪声具有随机性、不确定性,会干扰正常信号的接收与处理。在CT成像领域,噪声的存在不仅影响图像的纹理,还会导致衰减系数μ的测量值与其真实值之间存在偏差。在临床实践中,降低噪声对于提升CT图像质量至关重要。为了减少噪声对衰减系数μ测量的影响,提高ρe和Zeff的测量精度,选择恰当的扫描参数和应用高效的噪声抑制技术显得尤为关键。
CT噪声主要与探测器接收的X射线光子量有关,增加X射线能量或扫描剂量可以降低噪声水平。Landry等[17]的研究表明,随着曝光剂量的增加,模体中脂肪、水、肌肉等效组织插件的ρe和Zeff的区分度提高,同时在近距离放疗的蒙特卡洛模拟中,剂量计算的误差也相应减小。然而,Hua等[16]的研究发现,在不同的管电压和剂量水平下,ρe和Zeff的测量展现出较高的准确性和稳定性。这一结果可能与Hua等[16]使用的曝光剂量范围较窄,而Landry等[17]则采用了0.5至4倍的剂量范围有关。
除了剂量和能量外,迭代算法也是影响CT噪声的关键因素。与传统的滤波反投影(filtered back projection,FBP)算法相比,迭代重建算法有效地降低了图像噪声并提高了图像质量[18-20]。Landry等[17]发现正弦图确定迭代重建(sinogram-affirmed iterative reconstruction,SAFIRE)算法在降低ρe和Zeff的标准偏差方面表现优于FBP算法,尤其在使用最大强度时。也有其他研究指出,ρe和Zeff的测量精度与迭代重建算法的强度并无明显关联[16,21],这可能与不同研究中使用的CT机品牌和型号有关。
除了上述参数,层厚、螺距、旋转时间、卷积核等其他扫描参数同样对CT噪声有着显著影响,这些因素对ρe和Zeff测量准确性的影响值得进一步研究和探讨。
2. 不同双能量成像模式CT对ρe和Zeff的测量研究
根据不同的双能量实现方式,DECT可分为单源瞬时管电压切换模式、单源序列扫描模式、双源双能量扫描模式、单源双光束模式和单源双层探测器模式[22](图1)。DECT通过获取物质在两种不同能量下的X射线衰减信息,利用物质在不同能量下的衰减差异进行物质分解和定量分析(图2和图3)。
![]()
![]() 图 3 电子密度和有效原子序数在胆脂瘤患者中的应用注:女,61岁,胆脂瘤伴肉芽肿。Figure 3. Application of electron density and effective atomic number in patients with cholesteatoma.
图 3 电子密度和有效原子序数在胆脂瘤患者中的应用注:女,61岁,胆脂瘤伴肉芽肿。Figure 3. Application of electron density and effective atomic number in patients with cholesteatoma.(1)单源瞬时管电压切换模式DECT可在机架旋转期间实现高低电压的快速切换,尽管X射线投影角度几乎相同,允许基于投影数据域进行能量解析,但由于时间分辨力的损失,会在一定程度上影响能量解析的准确性。
当前的研究在评估Zeff测量的准确性方面展现了不同结果[21,24,25]。例如,Goodsitt等[24]通过模体实验得出Zeff的测量相对误差控制在15% 以内的结论。相对地,Kawahara等[25]报告称Zeff的测量相对误差在5.1% 以内。这种差异可能是因为各研究中所采用的CT机型和扫描参数不同,以及模体材料和结构的多样性所致。在ρe测量的准确性方面,Ogata等[26]发现在不同单能级图像中,模体所有材料的ρe测量相对误差控制在1.1% 以内。目前,基于单源瞬时管电压切换模式的DECT测量ρe准确性的研究相对较少,未来可进一步探索。
(2)单源序列扫描模式DECT分别以高、低能量进行两次扫描实现双能量成像。两套独立的高低能量图像具有完全的能量分离效果,这种特性有助于提高ρe和Zeff的测量准确性。当前,相关研究表明ρe和Zeff的测定具有较高的精度,有助于提高放射治疗计划的准确性[14,27-29]。其中Schaeffer等[14]基于模体实验发现Zeff的测量相对误差为3.2%,并且认为与Kawahara等[25]基于单源瞬时管电压切换模式 DECT的研究结果相似(Zeff的测量相对误差为2.5%)。
在单源序列扫描成像模式下,两次球管旋转扫描之间存在一定的时间(如某品牌CT高低管电压扫描间隔为180~800 ms[28]),可能会影响空间配准效果,并且在临床实践中由于受到受检者运动的影响,导致材料分解存在偏差[30]。此外,较大的能谱分离效果有助于产生更好的材料区分效果,提高ρe和Zeff的准确性。目前单源序列扫描模式DECT的高能量成像多采用135 kVp的管电压,能谱分离效果略低于单源瞬时管电压切换模式DECT的140 kVp[25]。
(3)双源双能量扫描模式DECT具有较大的能谱分离优势,它采用两套X射线球管和探测器,对同一解剖平面分别发射高、低管电压的X射线并由相应的探测器采集数据。
随着技术的进步,目前双源DECT多采用能谱纯化技术进一步增大能谱分离效果,减少射线束硬化伪影,提高了ρe和Zeff的测量准确性[15,31-32]。然而,两套探测器的空间位置设计也会对ρe和Zeff的测量带来一定的影响,仅35.5 cm的全扫描视野,对于超力型成年受检者的ρe和Zeff的测量具有局限性。此外,鉴于高、低能量数据采集的相位差异,该双能量CT采用了一种对噪声反应更为敏感的图像域能量解析技术。然而,当两套探测器同时捕获高能和低能X射线时,交叉散射的产生是不可避免的,这种散射会加剧噪声,从而可能对ρe和Zeff的精确测量带来不利影响。
(4)单源双光束模式DECT采用分离滤波技术,使X射线束预先分离成高、低能量的两种光子束,由对应位置的探测器沿Z轴方向分别接收,使得同一解剖区域接收高、低能两种X射线束存在时间差异,同样地基于图像域进行能量解析。尽管该模式DECT在成像过程中也容易受到光子交叉、散射等影响,但是相关研究发现单源双光束模式DECT在测量ρe和Zeff的准确性方面劣于双源DECT[15]。该研究发现第2代、第3代双源DECT的ρe和Zeff的测量相对误差分别在1.2% 和6.2% 以内,然而单源双光束DECT的ρe和Zeff的测量相对误差最大可达15.3% 和28.1%。较大的测量误差可能源于单源双光束DECT的高能和低能数据均源自相同的管电压设置,这种设计导致能谱分离效果相对较弱,从而使得成像系统对图像噪声和伪影更为敏感,影响了ρe和Zeff的准确性。
(5)单源双层探测器模式DECT同样对高能和低能数据采用了相同的管电压设置,并且存在使用相同管电流所致的高、低能光谱图像的噪声水平不同的局限,但相关研究显示出了稳健的ρe和Zeff的测量准确性[16,33]。
Hua等[16]基于模体实验发现ρe的测量相对误差范围在 -0.1% 至1.1%,Zeff的测量相对误差范围为 -2.3% 至1.7%。这些发现可以归因于该模式的DECT采用了独特的设计:一个X射线球管与空间上对称分布的上下两层探测器相结合。这种双层探测器配置能够同步捕获高、低能量的X射线信息,实现了基于投影数据域的材料分解[34]。从理论上讲,这种方法相较于基于图像域的材料分解具有一定的优势。
3. 总结与展望
DECT根据不同能量下物质衰减系数μ的差异进行物质分解,以实现单能量CT扫描无法评估的物质特性,其中ρe和Zeff在评估材料特性和放疗剂量估算中发挥着重要的作用。本文重点探讨影响ρe和Zeff测量精度的射线束硬化效应和噪声两大关键因素,并详细分析不同双能量成像模式CT对ρe和Zeff测量准确性的具体影响,明确了各成像模式的优势与局限。
鉴于此,未来的研究需进一步探索和优化算法,以减轻射线束硬化效应和噪声的不利影响,从而提升图像质量和测量的精确度。同时,由于不同双能量成像模式CT对ρe和Zeff测量准确性的差异化影响,未来的工作还需对这些成像模式进行细致的比较研究,并针对不同双能量成像模式CT,探索所使用机型的最佳成像条件以提高ρe和Zeff的测量准确性。
-
![]()
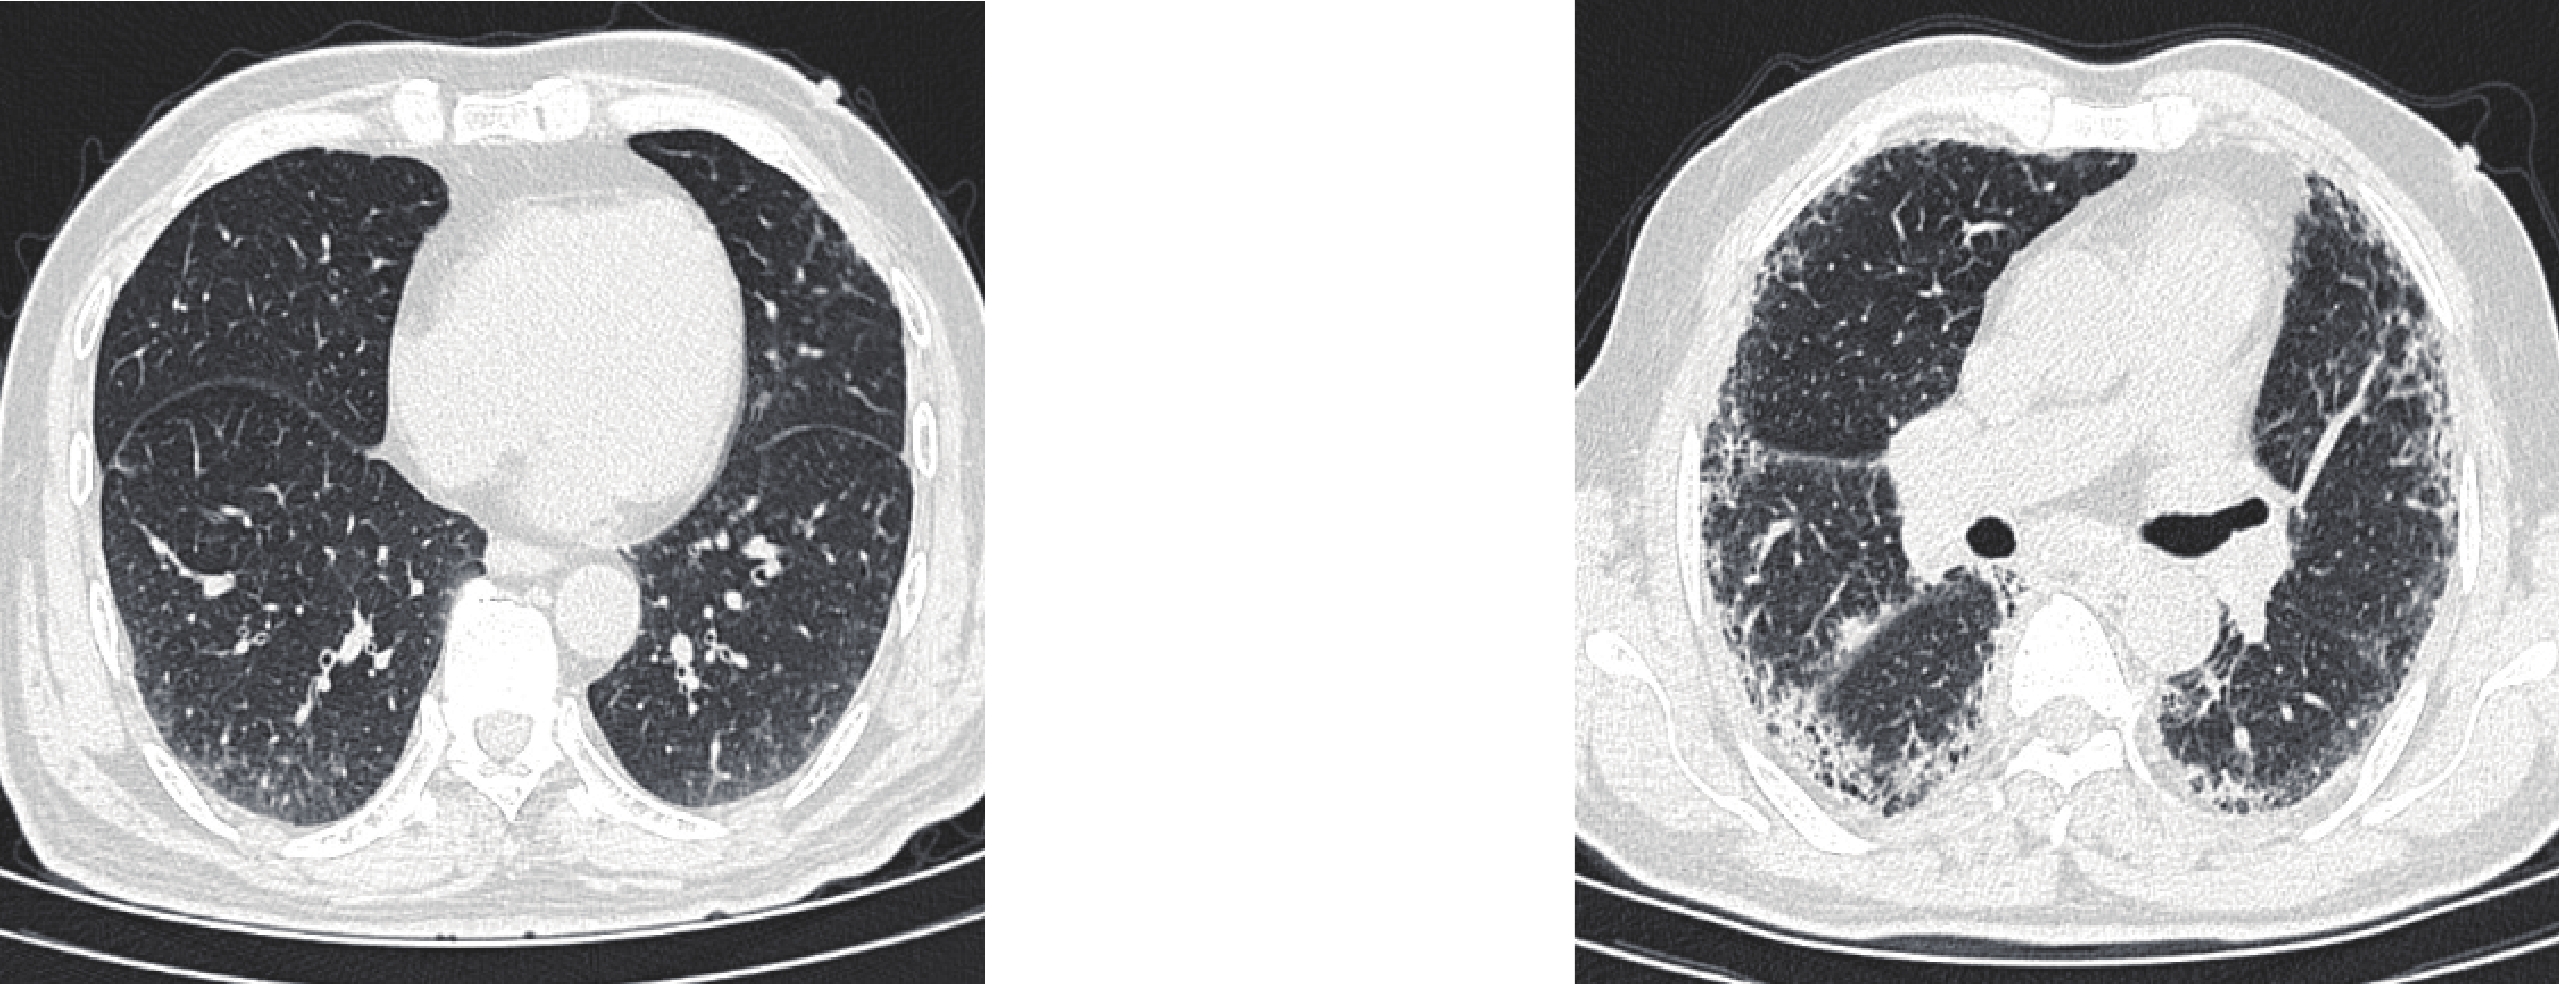
图 1 CTD-ILA(a)和CTD-ILD(b)HRCT示例图
注:(a)一名59岁系统性红斑狼疮女性患者,按照指南诊断ILA,患者尚无呼吸系统症状。(b)一名66岁类风湿关节炎男性患者,按照指南诊断ILD,患者存在呼吸系统症状。
Figure 1. Representative HRCT images of CTD-ILA (a) and CTD-ILD (b)
![]()
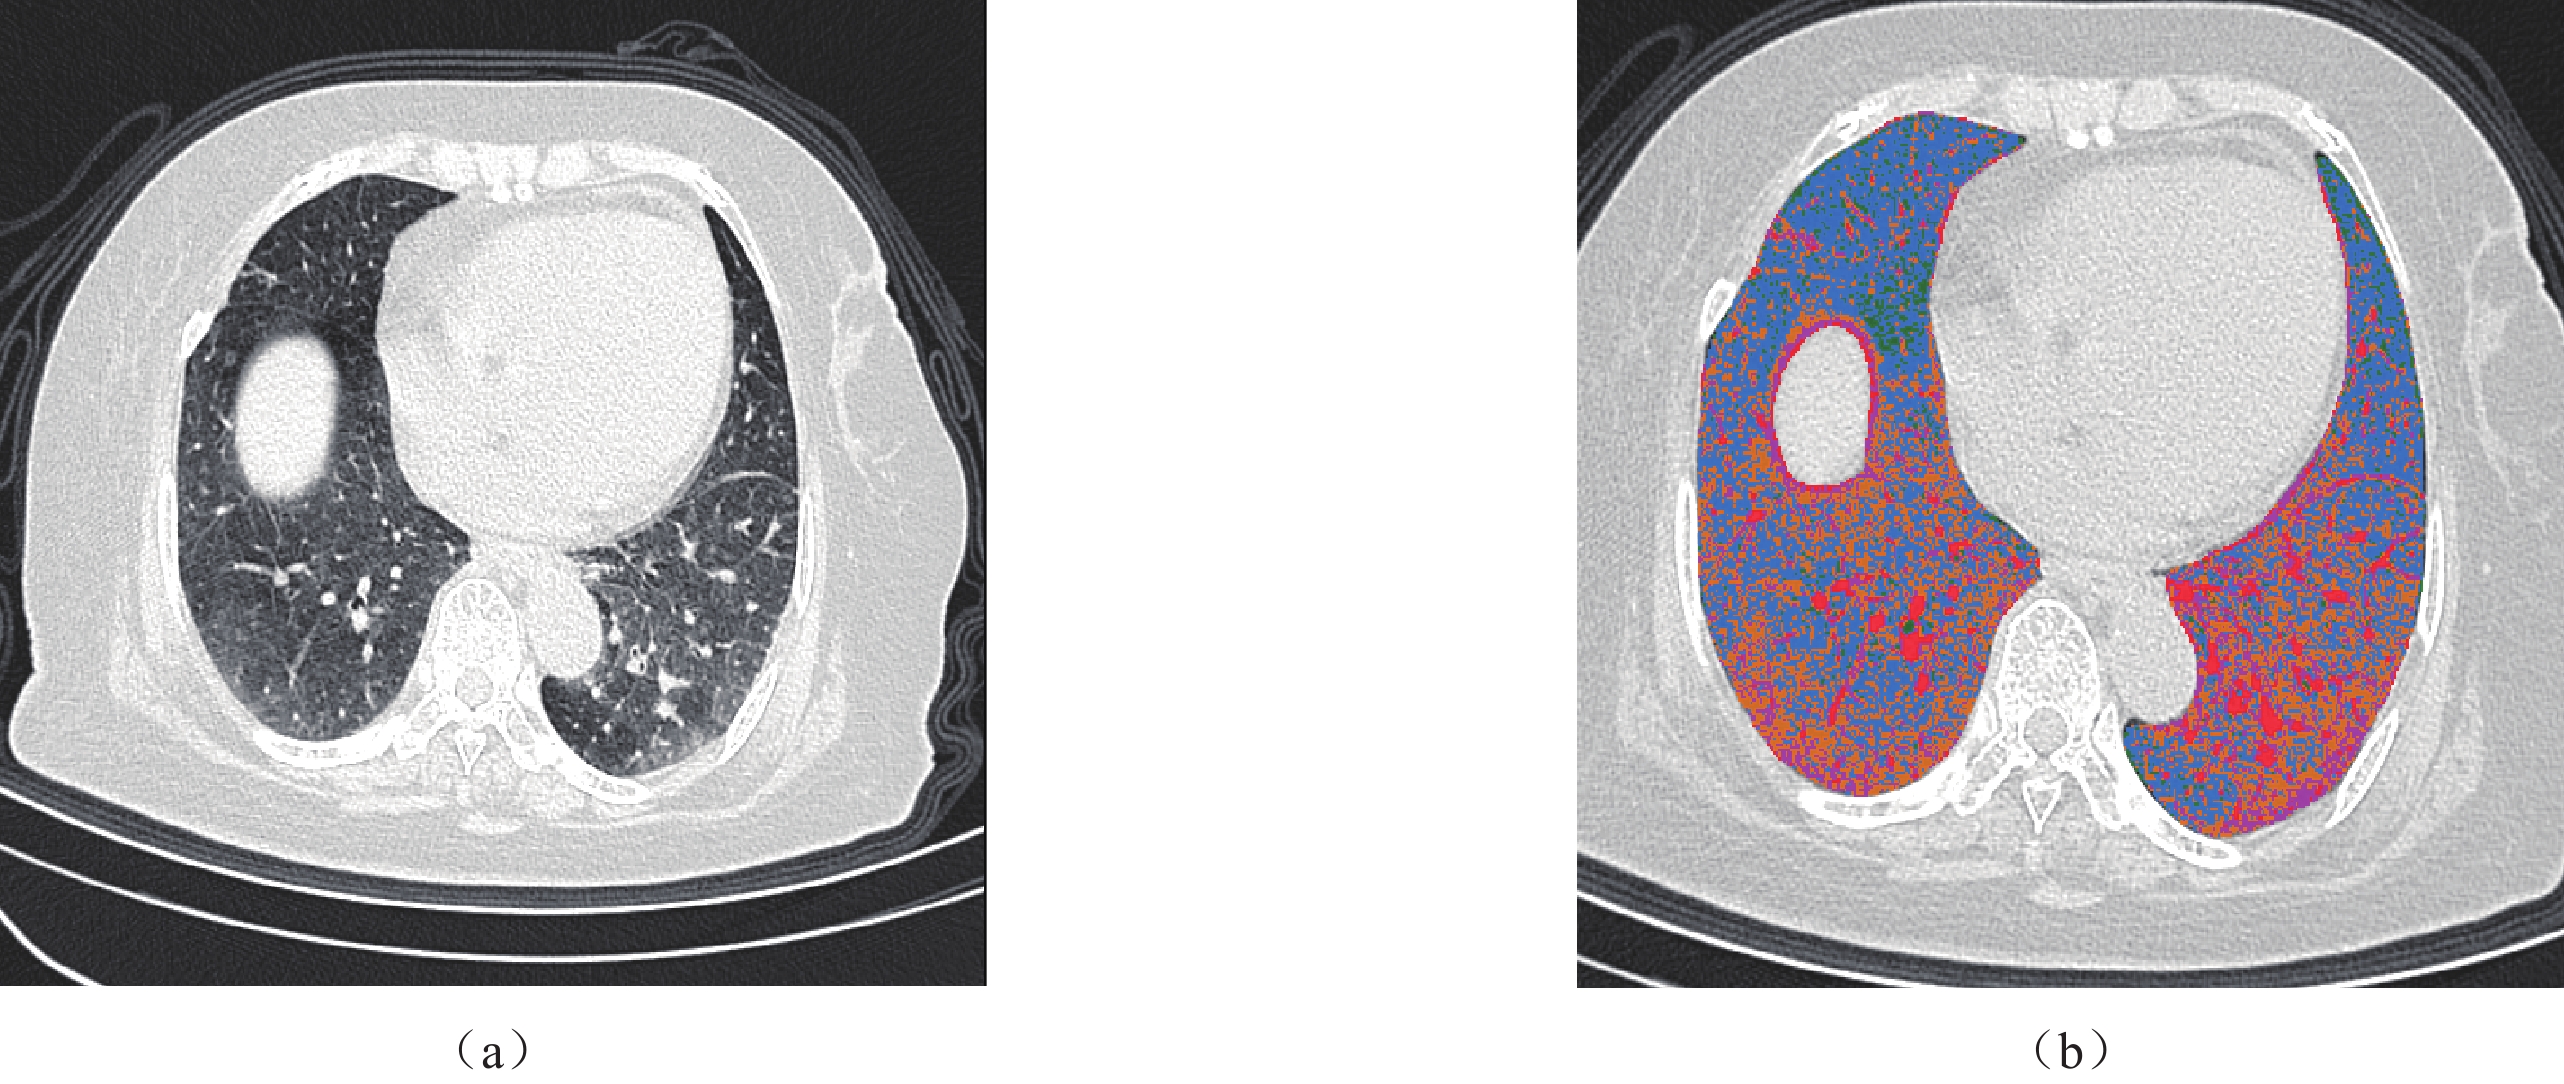
图 3 密度阈值分割法示例图
注:(a)为CT横断位图,(b)为定量CT分割结果图。蓝色代表正常肺组织(NL%),橙色表示磨玻璃样混浊区域(GGO%),粉红色表示纤维化区域(F%),红色表示血管。磨玻璃样混浊区和纤维化区的百分比之和被设置为异常病变区的百分比(AA%)。
Figure 3. Schematic illustration of density threshold segmentation methodology
![]()
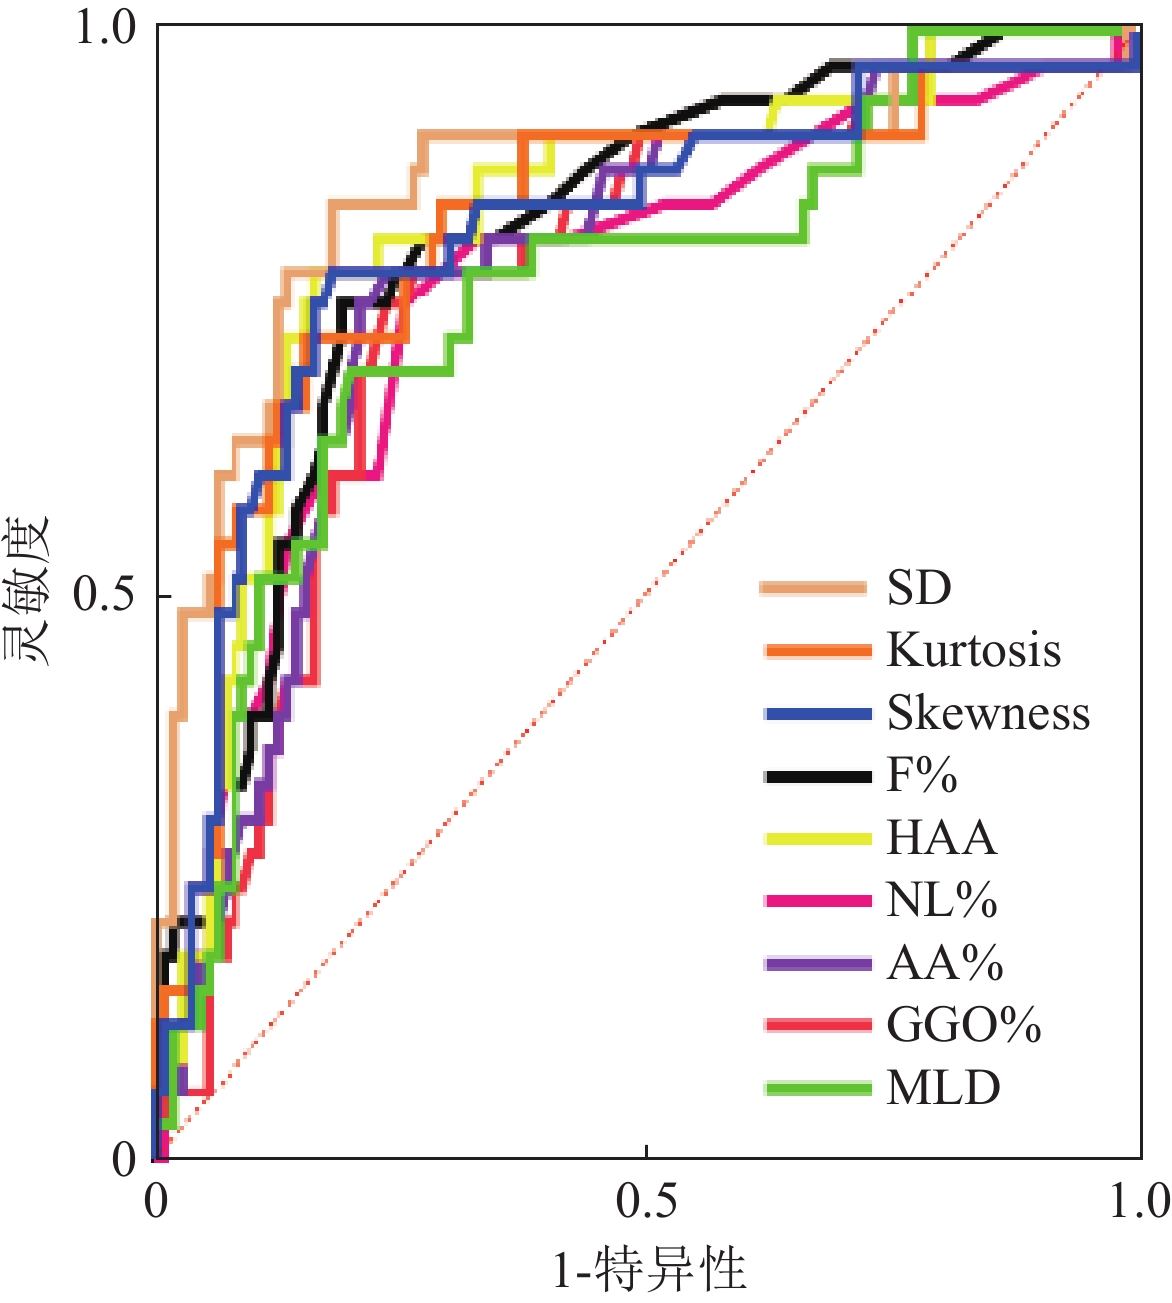
图 4 定量CT指标区分对照组与CTD-ILA ROC曲线
Figure 4. Receiver operating characteristic (ROC) curves of quantitative CT metrics for discriminating between control group and CTD-ILA patients
![]()
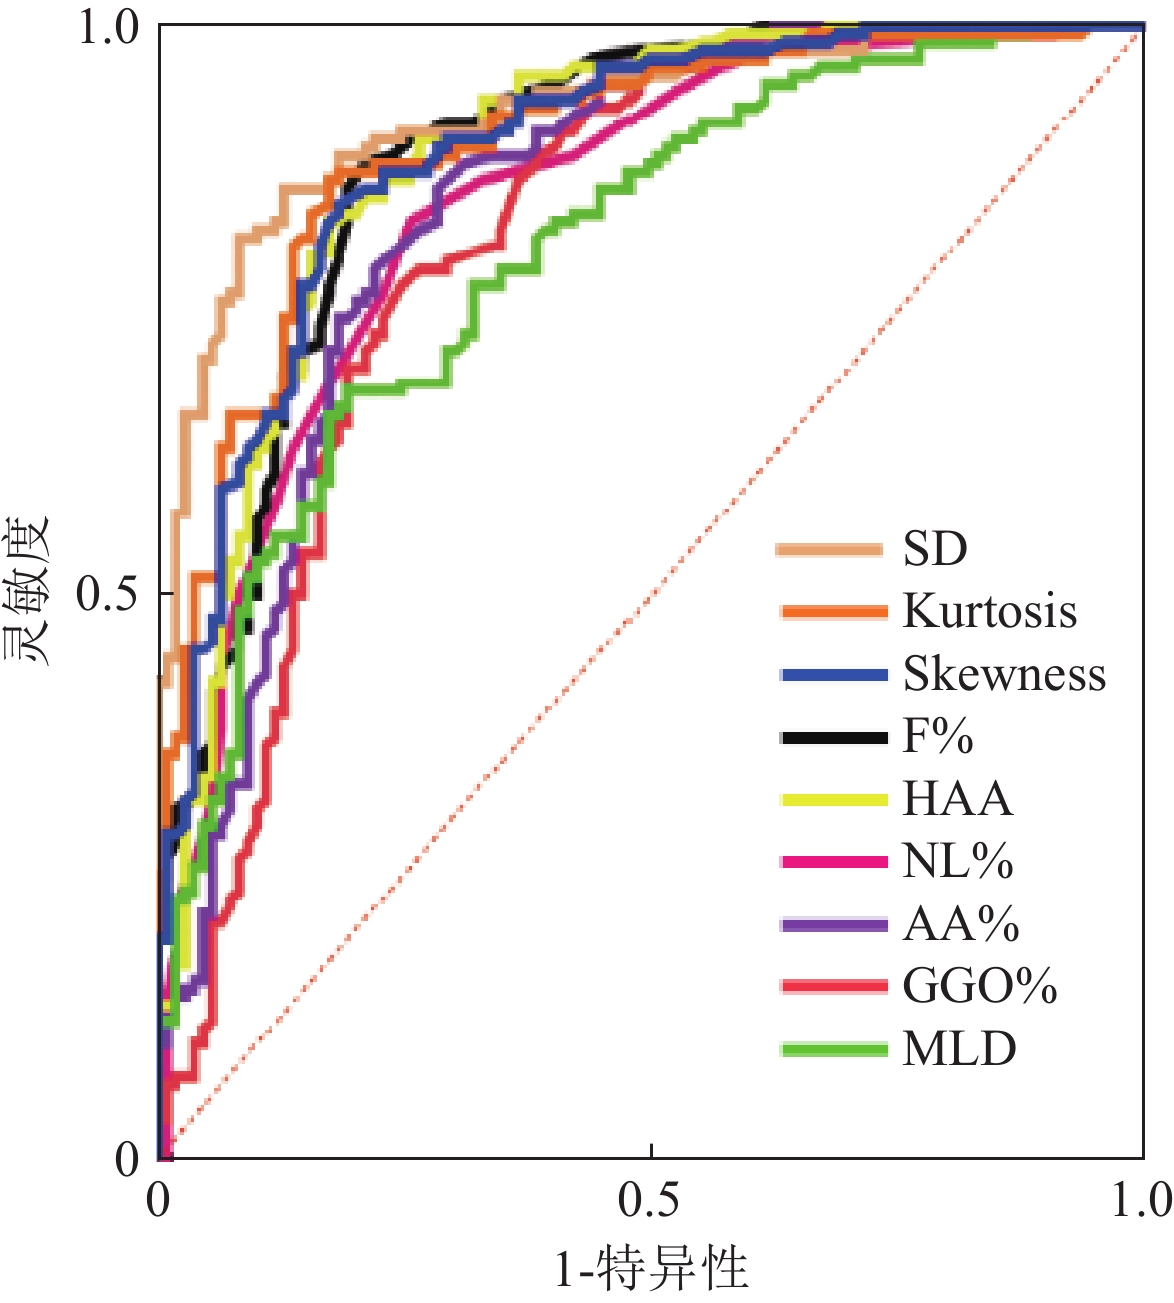
图 5 定量CT指标区分对照组与CTD-ILD ROC曲线
Figure 5. Receiver operating characteristic (ROC) curves of quantitative CT metrics for differentiating between control group from CTD-ILD patients
![]()
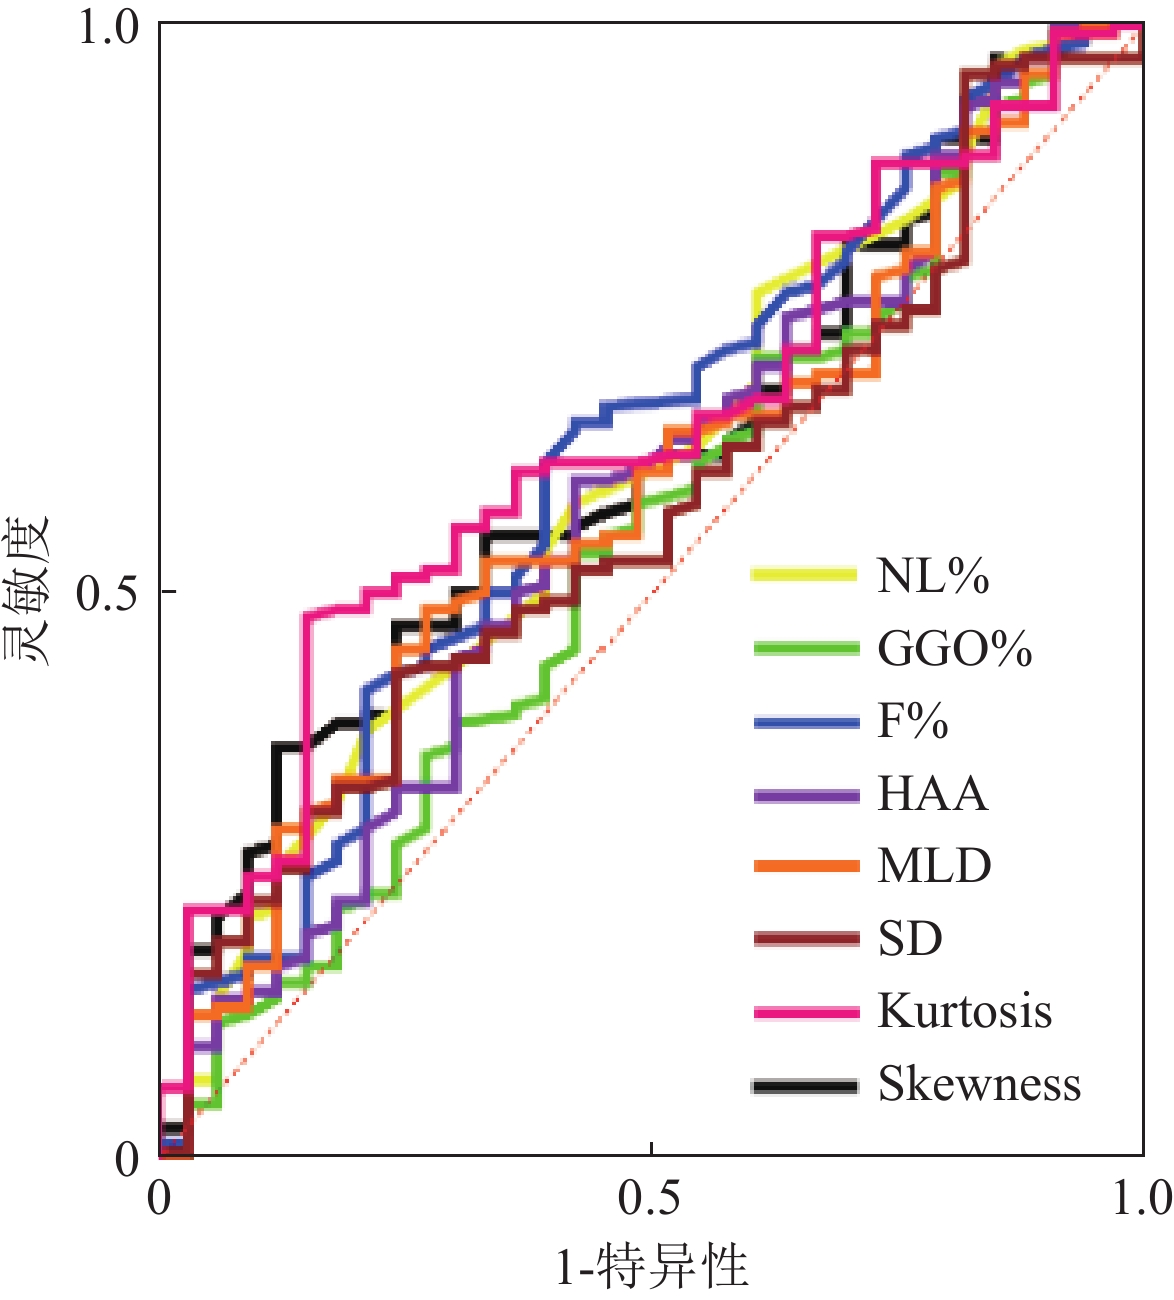
图 6 定量CT指标区分CTD-ILA与CTD-ILD ROC曲线
Figure 6. Receiver operating characteristic (ROC) curves of quantitative CT metrics for discriminating between CTD-ILA and CTD-ILD
表 1 患者临床资料表
Table 1 Demographic and clinical characteristics of study participants
对照组(n=109) CTD-ILA(n=33) CTD-ILD(n=140) F/H p 性别(%) 14.52 0.001 男 19(17.3) 14(42.4) 53(37.9) 女 90(81.8) 19(57.6) 87(62.1) 年龄 40(19) 64(11) 62.5(14) 104.52 0.000 BMI 22.54(2.81) 21.89(3.08) 22.34(4.39) 0.29 0.864 病程 3(7) 5(11.25) 4(10.75) 3.25 0.187 CTD类型(%) 9.66 0.008 类风湿关节炎 63(57.3) 22(66.7) 67(47.9) 系统性红斑狼疮 24(21.8) 5(15.2) 10(7.1) 系统性硬化症 2(1.8) 2(6.1) 15(10.7) 干燥综合症 9(8.2) 2(6.1) 16(11.4) 皮肌炎 − 2(6.1) 8(5.7) 弥漫性结缔组织病 7(6.4) − 15(10.7) ANCA相关血管炎 4(3.6) 2(6.1) 9(6.4) CT分型(%) 1.12 0.291 普通型间质性肺炎 − 7(21.2) 41(29.3) 非特异性间质性肺炎 − 18(54.5) 71(50.7) 淋巴细胞性间质性肺炎 − 4(12.1) 22(15.7) 机化性肺炎 − 4(12.1) 6(4.3)  下载: 导出CSV
表 2 各组间定量CT指标差异
Table 2 Intergroup differences in quantitative CT metrics among controls, CTD-ILA, and CTD-ILD cohorts
对照组(n=109) CTD-ILA(n=22) CTD-ILD(n=140) F/H p NL% 74(7) 68.0(7.5)* 65.5(9)* 89.82 0.000 GGO% 5.7(3.7) 11.3(8.75)* 12.65(9.1)* 76.00 0.000 F% 2.9(1.25) 5.2(3.4)* 6.6(4.98)* 113.72 0.000 AA% 8.8(4.9) 16.40(11.80)* 19.35(12.67)* 89.51 0.000 HAA 4.04(2.18) 9.25±5.26* 9.44(6.92)* 114.05 0.000 MLD −830.16(49.19) −777.08(59.02)* −768.19(93.69)* 70.18 0.000 SD 179.94(16.38) 205.52(25.83)* 220.19(41.43)* 139.60 0.000 Kurtosis 13.62±4.20 6.77(4.91)* 5.28(5.64)* 122.59 0.000 Skewness 3.27(0.71) 2.34(0.74)* 2.19±0.60* 115.41 0.000 注:*表示与对照组相比P<0.05。NL%:正常肺区域的百分比;GGO%为磨玻璃密度区域的百分比;F%为纤维化区域的百分比;AA%为异常病变区域的百分比;HAA为高衰减区;MLA为平均肺衰减;SD为标准差;kurtosis为峰值;skewness为偏度。
下载: 导出CSV
表 3 定量CT指标区分对照组与CTD-ILA的ROC曲线分析结果
Table 3 ROC curve analysis of quantitative CT metrics for discriminating control groups from CTD-ILA patients
AUC1 P 最佳截断值 灵敏度 特异度 约登指数 NL% 0.770 0.001 < 71.50 0.758 0.743 0.501 GGO% 0.774 0.001 > 8.000 0.788 0.734 0.522 F% 0.814 0.001 > 4.050 0.758 0.807 0.565 AA% 0.785 0.001 > 12.20 0.788 0.762 0.549 HAA 0.830 0.001 > 6.121 0.788 0.835 0.623 MLD 0.763 0.001 > −800.9 0.697 0.798 0.495 SD 0.862 0.001 > 191.2 0.849 0.817 0.665 Kurtosis 0.821 0.001 < 9.615 0.727 0.844 0.571 Skewness 0.816 0.001 < 2.795 0.788 0.817 0.604 注:NL% 为正常肺区域的百分比;GGO%为磨玻璃密度区域的百分比;F%为纤维化区域的百分比;AA%为异常病变区域的百分比;HAA为高衰减区;MLA为平均肺衰减;SD为标准差; kurtosis为峰值; skewness为偏度。
下载: 导出CSV
表 4 定量CT指标区分对照组与CTD-ILD的ROC曲线分析结果
Table 4 ROC curve analysis of quantitative CT metrics for differentiating control groups from CTD-ILD patients
AUC2 P 最佳截断值 灵敏度 特异度 约登指数 NL% 0.844 0.000 < 71.50 0.829 0.743 0.572 GGO% 0.815 0.000 > 8.350 0.771 0.752 0.524 F% 0.886 0.000 > 4.050 0.727 0.807 0.535 AA% 0.843 0.000 > 11.30 0.857 0.716 0.573 HAA 0.885 0.000 > 6.205 0.727 0.844 0.571 MLD 0.801 0.000 > −798.2 0.636 0.826 0.462 SD 0.923 0.000 > 191.2 0.864 0.817 0.680 Kurtosis 0.896 0.000 < 11.74 0.818 0.706 0.525 Skewness 0.889 0.000 < 2.795 0.727 0.817 0.544 注:NL%为正常肺区域的百分比;GGO%为磨玻璃密度区域的百分比;F%为纤维化区域的百分比;AA%为异常病变区域的百分比;HAA为高衰减区;MLA为平均肺衰减;SD为标准差; kurtosis为峰值; skewness为偏度。
下载: 导出CSV
表 5 定量CT指标区分CTD-ILA与CTD-ILD的ROC曲线分析结果
Table 5 ROC curve analysis of quantitative CT metrics for differentiating CTD-ILA from CTD-ILD
AUC3 P 最佳截断值 灵敏度 特异度 约登指数 NL% 0.600 0.074 < 63.50 0.379 0.788 0.167 GGO% 0.544 0.435 > 12.10 0.536 0.576 0.112 F% 0.617 0.037 > 5.450 0.650 0.576 0.226 AA% 0.574 0.187 > 16.85 0.600 0.576 0.176 HAA 0.585 0.128 > 10.06 0.486 0.727 0.213 MLD 0.568 0.224 > −758.5 0.429 0.758 0.186 SD 0.649 0.008 > 219.1 0.529 0.758 0.286 Kurtosis 0.638 0.014 < 5.095 0.479 0.849 0.327 Skewness 0.614 0.042 < 1.932 0.364 0.879 0.243 注:NL%为正常肺区域的百分比;GGO%为磨玻璃密度区域的百分比;F%为纤维化区域的百分比;AA%为异常病变区域的百分比;HAA为高衰减区;MLA为平均肺衰减;SD为标准差; kurtosis为峰值; skewness为偏度。
下载: 导出CSV
表 6 定量CT指标预测ILA与ILD多因素多元logistic回归结果
Table 6 Multivariate logistic regression analysis of quantitative CT metrics in predicting ILA vs. ILD
β BE wald P OR 95%CI 下限 上限 ILA F% 0.620 0.225 7.629 0.006 1.859 1.197 2.887 GGO% −0.302 0.098 9.546 0.002 0.739 0.610 0.895 SD 0.015 0.006 6.784 0.009 1.016 1.004 1.027 Kurtosis −0.370 0.069 28.727 0.000 0.691 0.603 0.791 ILD F% 0.854 0.209 16.666 0.000 2.349 1.559 3.540 GGO% −0.454 0.092 24.385 0.000 0.635 0.530 0.760 SD 0.026 0.005 23.855 0.000 1.026 1.016 1.037 Kurtosis −0.439 0.062 50.962 0.000 0.645 0.571 0.727 注:NL%为正常肺区域的百分比;GGO%为磨玻璃密度区域的百分比;F%为纤维化区域的百分比;AA%为异常病变区域的百分比;HAA为高衰减区;MLA为平均肺衰减;SD为标准差; kurtosis为峰值; skewness为偏度。
下载: 导出CSV
-
[1] TOMASSETTI S, POLETTI V, RAVAGLIA C, et al. Incidental discovery of interstitial lung disease: diagnostic approach, surveillance and perspectives[J]. European Respiratory Review, 2022, 31(164): 210206. DOI: 10.1183/16000617.0206-2021.
[2] HATABU H, HUNNINGHAKE G M, RICHELDI L, et al. Interstitial lung abnormalities detected incidentally on CT: Position Paper from the Fleischner Society[J]. The Lancet Respiratory Medicine, 2020, 8(7): 726-737. DOI: 10.1016/S2213-2600(20)30168-5.
[3] GARCíA MULLOR M M, ARENAS-JIMéNEZ J J, UREñA VACAS A, et al. Prevalence and prognostic meaning of interstitial lung abnormalities in remote CT scans of patients with interstitial lung disease treated with antifibrotic therapy[J]. Radiología (English Edition), 2024, 66: S10-S23. DOI: 10.1016/j.rxeng.2023.03.006.
[4] SEOK J, PARK S, YOON E C, et al. Clinical outcomes of interstitial lung abnormalities: A systematic review and meta-analysis[J/OL]. Scientific Reports, 2024, 14(1): 7330. DOI: 10.1038/s41598-024-57831-3.
[5] AXELSSON G T, PUTMAN R K, ASPELUND T, et al. The associations of interstitial lung abnormalities with cancer diagnoses and mortality[J]. European Respiratory Journal, 2020, 56(6): 1902154. DOI: 10.1183/13993003.02154-2019.
[6] DONG H, JULIEN P J, DEMORUELLE M K, et al. Interstitial lung abnormalities in patients with early rheumatoid arthritis: A pilot study evaluating prevalence and progression[J]. European Journal of Rheumatology, 2018, 6(4): 193-198. DOI: 10.5152/eurjrheum.2019.19044.
[7] JEE A S, SHEEHY R, HOPKINS P, et al. Diagnosis and management of connective tissue disease‐associated interstitial lung disease in Australia and New Zealand: A position statement from the Thoracic Society of Australia and New Zealand[J]. Respirology, 2021, 26(1): 23-51. DOI: 10.1111/resp.13977.
[8] HU Z, WANG H, HUANG J, et al. Cardiovascular disease in connective tissue disease-associated interstitial lung disease: A systematic review and meta-analysis of observational studies[J]. Autoimmunity Reviews, 2024, 23(10): 103614. DOI: 10.1016/j.autrev.2024.103614.
[9] JEGANATHAN N, SATHANANTHAN M. Connective tissue disease-related interstitial lung disease: prevalence, patterns, predictors, prognosis, and treatment[J]. Lung, 2020, 198(5): 735-759. DOI: 10.1007/s00408-020-00383-w.
[10] SPAGNOLO P, RYERSON C J, PUTMAN R, et al. Early diagnosis of fibrotic interstitial lung disease: Challenges and opportunities[J]. The Lancet Respiratory Medicine, 2021, 9(9): 1065-1076. DOI: 10.1016/S2213-2600(21)00017-5.
[11] PRITCHARD D, ADEGUNSOYE A, LAFOND E, et al. Diagnostic test interpretation and referral delay in patients with interstitial lung disease[J]. Respiratory Research, 2019, 20(1): 253. DOI: 10.1186/s12931-019-1228-2.
[12] CANO-JIMéNEZ E, VáZQUEZ RODRíGUEZ T, MARTíN-ROBLES I, et al. Diagnostic delay of associated interstitial lung disease increases mortality in rheumatoid arthritis[J]. Scientific Reports, 2021, 11(1): 9184. DOI: 10.1038/s41598-021-88734-2.
[13] PETNAK T, LERTJITBANJONG P, THONGPRAYOON C, et al. Impact of antifibrotic therapy on mortality and acute exacerbation in idiopathic pulmonary fibrosis[J]. Chest, 2021, 160(5): 1751-1763. DOI: 10.1016/j.chest.2021.06.049.
[14] GHAZIPURA M, MAMMEN M J, HERMAN D D, et al. Nintedanib in progressive pulmonary fibrosis: A systematic review and meta-analysis[J]. Annals of the American Thoracic Society, 2022, 19(6): 1040-1049. DOI: 10.1513/AnnalsATS.202103-343OC.
[15] DUBEY S, WOODHEAD F. Survival differences in rheumatoid arthritis interstitial lung disease and idiopathic pulmonary fibrosis may be explained by delays in presentation: results from multivariate analysis in a monocentric UK study[J]. Rheumatology International, 2023, 44(1): 99-105. DOI: 10.1007/s00296-023-05505-0.
[16] HEWITT R J, BARTLETT E C, GANATRA R, et al. Lung cancer screening provides an opportunity for early diagnosis and treatment of interstitial lung disease[J]. Thorax, 2022, 77(11): 1149-1151. DOI: 10.1136/thorax-2022-219068.
[17] GUIOT J, MIEDEMA J, CORDEIRO A, et al. Practical guidance for the early recognition and follow-up of patients with connective tissue disease-related interstitial lung disease[J]. Autoimmunity Reviews, 2024, 23(6): 103582. DOI: 10.1016/j.autrev.2024.103582.
[18] KIM M S, CHOE J, HWANG H J, et al. Interstitial lung abnormalities (ILA) on routine chest CT: Comparison of radiologists’ visual evaluation and automated quantification[J]. European Journal of Radiology, 2022, 157: 110564. DOI: 10.1016/j.ejrad.2022.110564.
[19] CHAE K J, JIN G Y, GOO J M, et al. Interstitial lung abnormalities: What radiologists should know[J]. Korean Journal of Radiology, 2021, 22(3): 454. DOI: 10.3348/kjr.2020.0191.
[20] 杜雯娟, 赵祥博, 赵海峰, 等. 肺间质异常CT研究进展[J]. 生物医学工程与临床, 2025, 29(1): 129-133. DOI: 10.13339/j.cnki.sglc.20241220.009. [21] ALETAHA D, NEOGI T, SILMAN A J, et al. 2010 Rheumatoid arthritis classification criteria: an American College of Rheumatology/European League Against Rheumatism collaborative initiative[J]. Annals of the Rheumatic Diseases, 2010, 69(9): 1580-1588. DOI: 10.1136/ard.2010.138461.
[22] VAN DEN HOOGEN F, KHANNA D, FRANSEN J, et al. 2013 classification criteria for systemic sclerosis: an American college of rheumatology/European league against rheumatism collaborative initiative[J]. Annals of the Rheumatic Diseases, 2013, 72(11): 1747-1755. DOI: 10.1136/annrheumdis-2013-204424.
[23] LUNDBERG I E, TJäRNLUND A, BOTTAI M, et al. 2017 European League Against Rheumatism/American College of Rheumatology Classification Criteria for Adult and Juvenile Idiopathic Inflammatory Myopathies and Their Major Subgroups[J]. Arthritis & Rheumatology, 2017, 69(12): 2271-2282. DOI: 10.1002/art.40320.
[24] ARINGER M, COSTENBADER K, DAIKH D, et al. 2019 European League Against Rheumatism/American College of Rheumatology Classification Criteria for Systemic Lupus Erythematosus[J]. Arthritis & Rheumatology, 2019, 71(9): 1400-1412. DOI: 10.1002/art.40930.
[25] SUPPIAH R, ROBSON J C, GRAYSON P C, et al. 2022 American College of Rheumatology/European Alliance of Associations for Rheumatology classification criteria for microscopic polyangiitis[J]. Annals of the Rheumatic Diseases, 2022, 81(3): 321-326. DOI: 10.1136/annrheumdis-2021-221796.
[26] SHIBOSKI C H, SHIBOSKI S C, SEROR R, et al. 2016 American College of Rheumatology/European League Against Rheumatism Classification Criteria for Primary Sjögren’s Syndrome: A Consensus and Data‐Driven Methodology Involving Three International Patient Cohorts[J]. Arthritis & Rheumatology, 2017, 69(1): 35-45. DOI: 10.1002/art.39859.
[27] TANAKA Y, KUWANA M, FUJII T, et al. 2019 Diagnostic criteria for mixed connective tissue disease (MCTD): From the Japan research committee of the ministry of health, labor, and welfare for systemic autoimmune diseases[J]. Modern Rheumatology, 2021, 31(1): 29-33. DOI: 10.1080/14397595.2019.1709944.
[28] TRAVIS W D, COSTABEL U, HANSELL D M, et al. An Official American Thoracic Society/European Respiratory Society Statement: Update of the International Multidisciplinary Classification of the Idiopathic Interstitial Pneumonias[J]. American Journal of Respiratory and Critical Care Medicine, 2013, 188(6): 733-748. DOI: 10.1164/rccm.201308-1483ST.
[29] WIJSENBEEK M, SUZUKI A, MAHER T M. Interstitial lung diseases[J]. The Lancet, 2022, 400(10354): 769-786. DOI: 10.1016/S0140-6736(22)01052-2.
[30] FISCHER A, BOIS R DU. Interstitial lung disease in connective tissue disorders[J]. The Lancet, 2012, 380(9842): 689-698. DOI: 10.1016/S0140-6736(12)61079-4.
[31] AHN Y, LEE S M, CHOI S, et al. Automated CT quantification of interstitial lung abnormality and interstitial lung disease according to the Fleischner Society in patients with resectable lung cancer: prognostic significance[J]. European Radiology, 2023, 33(11): 8251-8262. DOI: 10.1007/s00330-023-09783-x.
[32] 杨凯, 张静平, 何立宇, 等. 基于定量CT评估多发性肌炎/皮肌炎相关间质性肺病患者肺部改变[J]. 中国临床医学影像杂志, 2024, 35(10): 694-699. YANG K, ZHANG J P, HE L Y, et al. Evaluation of pulmonary changes in patients with polymyositis/dermatomyositis-associated interstitial lung disease based on quantitative CT[J]. Journal of China Clinic Medical Imaging, 2024, 35(10): 694-699. (in Chinese).
[33] ZHANG H, LI X, ZHANG X, et al. Quantitative CT analysis of idiopathic pulmonary fibrosis and correlation with lung function study[J]. BMC Pulmonary Medicine, 2024, 24(1): 437. DOI: 10.1186/s12890-024-03254-9.
[34] JOHANNSON K A, CHAUDHURI N, ADEGUNSOYE A, et al. Treatment of fibrotic interstitial lung disease: current approaches and future directions[J]. The Lancet, 2021, 398(10309): 1450-1460. DOI: 10.1016/S0140-6736(21)01826-2.
[35] 马震忠, 盛亚丹, 杨凯, 等. 皮肌炎/多发性肌炎相关间质性肺病高分辨率CT特征[J]. CT理论与应用研究(中英文), 2024, 33(4): 497-502. DOI: 10.15953/j.ctta.2023.131. MA Z Z, SHENG Y D, YANG K, et al. HRCT features of dermatomyositis-/polymyositis- associated interstitial lung disease[J]. CT Theory and Applications, 2024, 33(4): 497-502. DOI: 10.15953/j.ctta.2023.131.
[36] 徐光兴, 俞咏梅 徐亮, 等. 皮肌炎/多发性肌炎并发间质性肺病的CT定量分析与肺功能的相关性研究[J]. 放射学实践, 2023, 38(5): 565-570. XU G X, YU Y M, XU L, et al. Correlation between CT quantitative analysis and pulmonary function of interstitial lung disease in derma-tomyositis/polymyositis[J]. Radiologic Practice, 2023, 38(5): 565-570. (in Chinese).
[37] JEGANATHAN N, SATHANANTHAN M. Connective tissue disease-related interstitial lung disease: Prevalence, patterns, predictors, prognosis, and treatment[J]. Lung, 2020, 198(5): 735-759. DOI: 10.1007/s00408-020-00383-w.
[38] GUISADO-VASCO P, SILVA M, DUARTE-MILLÁN M A, 等. Quantitative assessment of interstitial lung disease in Sjögren’s syndrome[J]. PLoS ONE, 2019, 14(11): e0224772. DOI: 10.1371/journal.pone.0224772. [39] UFUK F, DEMIRCI M, ALTINISIK G. Quantitative computed tomography assessment for systemic sclerosis–related interstitial lung disease: comparison of different methods[J]. European Radiology, 2020, 30(8): 4369-4380. DOI: 10.1007/s00330-020-06772-2.
[40] UFUK F, DEMIRCI M, ALTINISIK G, et al. Quantitative analysis of Sjogren’s syndrome related interstitial lung disease with different methods[J]. European Journal of Radiology, 2020, 128: 109030. DOI: 10.1016/j.ejrad.2020.109030.
[41] ALEVIZOS M K, DANOFF S K, PAPPAS D A, et al. Assessing predictors of rheumatoid arthritis-associated interstitial lung disease using quantitative lung densitometry[J]. Rheumatology, 2022, 61(7): 2792-2804. DOI: 10.1093/rheumatology/keab828.
[42] CHOI B, KAWUT S M, RAGHU G, et al. Regional distribution of high-attenuation areas on chest computed tomography in the multi-ethnic Study of atherosclerosis[J/OL]. ERJ Open Research, 2020, 6(1). [2024-10-16]. https://openres.ersjournals.com/content/6/1/00115-2019. DOI: 10.1183/23120541.00115-2019.
[43] HASAN D, IMAM H, MEGALLY H, et al. The qualitative and quantitative high-resolution computed tomography in the evaluation of interstitial lung diseases[J]. Egyptian Journal of Radiology and Nuclear Medicine, 2020, 51(1): 135. DOI: 10.1186/s43055-020-00254-7.
[44] SHIRAISHI Y, TANABE N, SAKAMOTO R, et al. Longitudinal assessment of interstitial lung abnormalities on CT in patients with COPD using artificial intelligence-based segmentation: a prospective observational study[J]. BMC Pulmonary Medicine, 2024, 24(1): 200. DOI: 10.1186/s12890-024-03002-z.


计量
- 文章访问数: 0
- HTML全文浏览量: 0
- PDF下载量: 0