The Clinical Value of Thin-section Chest Computed Tomography Scan for the Classification of Coronavirus Disease 2019 (COVID-19)
-
摘要: 目的:探讨胸部薄层CT平扫在新型冠状病毒感染(COVID-19)分型中的临床价值。方法:回顾性分析2022年12月20日至2022年12月31日于我院感染科诊断为COVID-19的134例患者,所有患者均行胸部薄层CT平扫检查,并具有完整的临床资料。根据临床分型将患者分为非重症组和重症组,对比分析两组患者的临床资料和肺部影像学特征并进行统计学分析。结果:两组间合并糖尿病的差异具有统计学意义,且重症组(45.8%)合并糖尿病的发生率高于非重症组(25.5%);两组间性别、年龄、平均病程及临床症状的差异均无统计学意义;两组之间病变数量、对称性分布、周围为主分布、弥漫分布、边缘模糊、大片状、束带状、血管束增厚、铺路石征、拱廊征以及煎蛋征的差异有统计学意义;重症组的病灶数量>10个、弥漫分布、大片状、束带状、血管束增厚、铺路石征、拱廊征的发生率高于非重症组,而非重症组的周围为主分布、边缘模糊以及煎蛋征的发生率高于重症组。结论:胸部薄层CT平扫能够明确新冠患者肺部异常影像学表现,评估病变的数量、分布范围及形态特点,合并基础病、病变数量、分布特点、边缘模糊、大片状、束带状、血管束增厚及铺路石征、拱廊征、煎蛋征等特殊征象能有效提示COVID-19分型,为COVID-19的诊治提供更多影像依据。Abstract: Objective: To investigate the clinical value of thin-section chest computed tomography (CT) in the typing of coronavirus disease 2019 (COVID-19). Methods: A retrospective analysis was performed on 134 patients diagnosed with COVID-19 in our hospital’s Department of Infectious Diseases from December 20, 2022, to December 31, 2022. All patients underwent thin-section chest CT scan with complete clinical data. According to clinical classification, patients were divided into the non-severe and severe groups. Clinical data and imaging features of the two groups were compared and analyzed, and statistical analysis was conducted. Results: There was a statistically significant difference with respect to diabetes mellitus between the two groups, and the incidence of diabetes mellitus in the severe group (45.8%) was higher than that in the non-severe group (25.5%); There were no significant differences in sex, age, average course of disease, and clinical symptoms between the two groups; There were significant differences in the number of lesions, symmetrical distribution, predominant peripheral distribution, diffuse distribution, blurred edge, morphology of large flake and band, vascular bundle thickening, paving stone sign, arcade sign, and fried egg sign between the two groups, the number of lesions >10, diffuse distribution, morphology of large flake and band, vascular bundle thickening, paving stone sign, and arcade sign were more common in the severe group than in the non-severe group, while predominant peripheral distribution, blurred edge, and fried egg sign were more common in the non-severe group than in the severe group. Conclusions: Thin-section chest CT scan can identify the abnormal imaging manifestations of the lung in patients with COVID-19 and evaluate the number, distribution range, and morphological characteristics of the lesions. Combined background diseases, number, distribution characteristics, blurred edge, large flake and band morphology, vascular bundle thickening, paving stone sign, arcade sign, and fried egg sign can effectively indicate the classification of patients with COVID-19. This can provide imaging evidence for the diagnosis and treatment of COVID-19.
-
Keywords:
- X-ray computer /
- tomography /
- COVID-19 /
- classification
-
新型冠状病毒感染(coronavirus disease 2019,COVID-19)是由新型冠状病毒引起的一种急性呼吸道传染性疾病[1]。该病起病急、传播快、普遍易感,由于侵及呼吸道不同部位而临床表现多样,根据临床分型,将该病分为轻型、普通型、重型及危重型[2]。影像学检查对其的诊断价值不可替代,目前,大多数学者仅单纯探讨COVID-19的肺部影像学表现[3-5],而极少有文献报道影像学检查对于COVID-19分型的诊断价值。
本文回顾性分析2022年12月20日至2022年12月31日于我院感染科诊断为COVID-19的134例患者,并根据临床分型进行分组,对于不同分型的COVID-19患者的临床特点及肺部影像学表现进行分析总结,以探讨胸部薄层CT平扫对于COVID-19分型的诊断价值,为临床诊断、治疗提供影像依据。
1. 材料与方法
1.1 一般资料
回顾性收集2022年12月20日至2022年12月31日期间于北京大学第九临床医学院(首都医科大学附属北京世纪坛医院)感染科确诊为COVID-19的134例患者的临床及影像资料。入组标准:符合国家卫健委《新型冠状病毒感染诊疗方案(试行第十版)》[2]中的诊断标准,且具有完整的胸部薄层CT平扫影像资料。
排除标准:不具备完整的临床资料及影像学检查资料的患者,胸部CT无异常的患者。134例新冠感染患者中,男73例(54.5%),女61例(45.5%),年龄26~98岁,平均年龄(69.6±15.0)岁,平均病程5 d,发热126例(94.0%),咳嗽120例(89.6%),肌痛21例(15.7%),咽痛42例(31.3%),胸闷14例(10.4%),腹泻9例(6.7%),纳差3例(2.2%),合并基础病87例(64.9%)。
1.2 检查方法
134例患者均接受胸部CT扫描,CT扫描仪为32排的北京赛诺威盛Insitum-CT 338机型,扫描参数设置:管电压120 kV,管电流150 mAs,螺距1.0。之后进行三维重建,横断面层厚为肺窗1.5 mm和纵隔窗5 mm,矩阵512×512,FOV 380~450;并进行冠状位和矢状位肺窗(1×5 mm)和纵隔窗(5×5 mm)重建。
1.3 图像分析
由两名放射科医师分别进行胸部CT平扫图像阅片,结果不一致时由另一位具有10年以上工作经验的高级医师评定最终阅片结果。
CT主要指标包括:①病变数量:分为单发和多发,多发又分为≤5个、≤10个和>10个;②部位:单肺、单叶、双肺、对称、非叶段;③分布:周围、中央;其中周围分布分为胸膜下和胸膜内,中央分布又分为沿血管束和血管外;④分布优势:上肺为主、下肺为主、周围为主、中央为主、弥漫分布;⑤病变类型:磨玻璃、实变、网格影、蜂窝影、血管束增厚、混合等;⑥病变边缘:模糊、不规则、光整、分叶、毛刺;⑦形态类型:结节、树芽、斑片、大片、束带状、肿块样、混合;⑧其他征象:小气道壁增厚、血管束增厚、晕征、反晕征、铺路石征、支气管充气征、空气潴留征、拱廊征、煎蛋征、胸膜凹陷征、胸膜尾征、分叶征、空泡征、毛刺征、内部索条、胸膜下黑带、胸膜下线、牵拉性支扩、纤维索条。
1.4 统计学分析
采用SPSS 26.0统计软件,对于不同分型的COVID-19患者的临床特点及肺部CT特征进行统计学分析,计量资料应用独立样本t检验,计数资料应用
$\chi^2$ 检验,P<0.05为差异具有统计学意义。2. 结果
2.1 新型冠状病毒感染患者的临床特点
根据临床分型进行分组,非重症组110例,重症组24例。两组之间合并基础病的差异有统计学意义,且重症组合并基础病(83.3%)的发生率高于非重症组(60.9%);两组间合并糖尿病的差异具有统计学意义,且重症组(45.8%)合并糖尿病的发生率高于非重症组(25.5%)。两组间性别、年龄、平均病程及临床症状的差异均无统计学意义(表1)。
表 1 134例新冠病毒感染患者的临床特点Table 1. Clinical characteristics of 134 patients with COVID-19项目 组别 P 非重症组(n=110) 重症组(n=24) 年龄 68.5±15.2 74.3±12.6 0.090 性别 男 58(52.7) 15(62.5) 0.384 女 52(47.3) 9(37.5) 0.384 平均病程/d 5.0 5.0 0.970 临床特征/例 发热 104(94.5) 22(91.7) 0.949 咳嗽 100(90.9) 20(83.3) 0.465 咽痛 35(31.8) 7(29.2) 0.800 胸闷 11(10.0) 3(12.5) 1.000 肌痛 17(15.5) 4(16.7) 1.000 腹泻 8(7.3) 1(4.2) 0.920 纳差 2(1.8) 1(4.2) 0.450 合并基础病/例 67(60.9) 20(83.3) 0.037 基础病类型/例 高血压 42(38.2) 12(50.0) 0.285 糖尿病 28(25.5) 11(45.8) 0.046 冠心病 22(20.0) 9(37.5) 0.065 脑血管病 16(14.5) 3(12.5) 1.000 2.2 不同分型的新型冠状病毒感染患者的CT表现
非重症组和重症组两组之间病变数量、对称性分布、周围为主分布、弥漫分布、边缘模糊(图1~图5)、大片状(图4)、束带状、血管束增厚、铺路石征(图6)、拱廊征(图5)以及煎蛋征(图1)的差异有统计学意义。重症组的病灶数量>10个(图7)、对称性分布(图6)、弥漫分布、大片状、束带状(图8)、血管束增厚、铺路石征、拱廊征的发生率高于非重症组,而非重症组的周围为主分布、边缘模糊以及煎蛋征的发生率高于重症组(表2)。
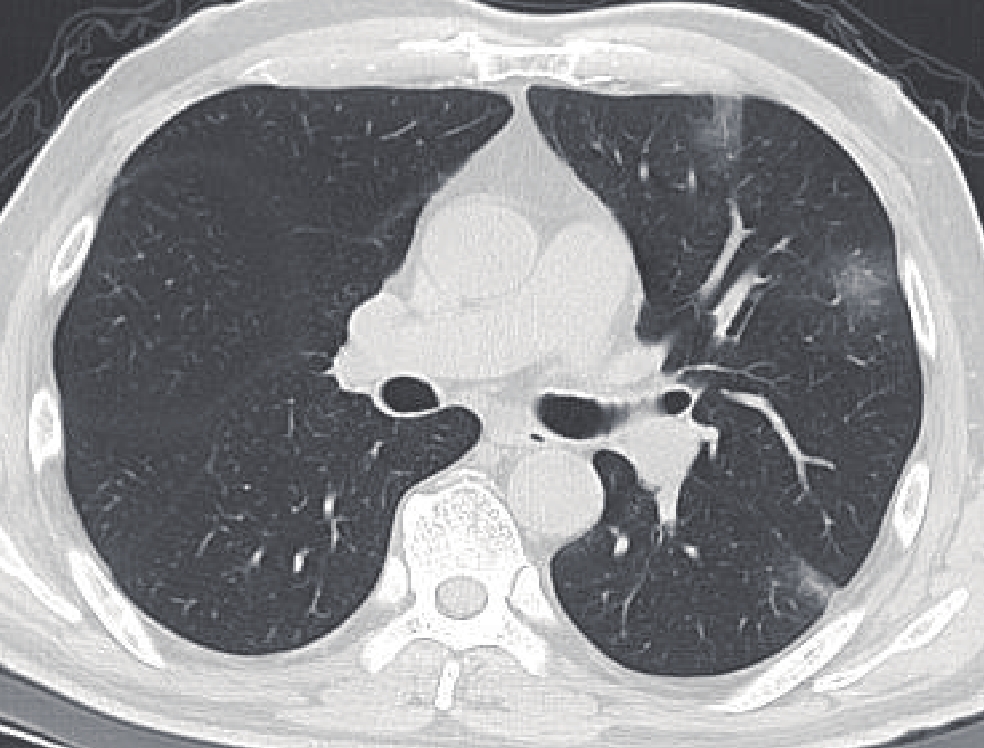
![]() 图 1 患者,男,非重症组,41岁,发热5 d,伴咽痛、流涕、咳嗽,Tmax 38.2℃,SPO2 98%。右肺背侧胸膜下见不规则煎蛋征(亚实性结节)(黑箭)Figure 1. A 41-year-old male patient in the non-critical group had a fever for 5 days, accompanied by sore throat, running nose, cough, Tmax 38.2℃, and SPO2 98%. Irregular fried egg sign is observed in the right dorsal subpleural area (black arrow)
图 1 患者,男,非重症组,41岁,发热5 d,伴咽痛、流涕、咳嗽,Tmax 38.2℃,SPO2 98%。右肺背侧胸膜下见不规则煎蛋征(亚实性结节)(黑箭)Figure 1. A 41-year-old male patient in the non-critical group had a fever for 5 days, accompanied by sore throat, running nose, cough, Tmax 38.2℃, and SPO2 98%. Irregular fried egg sign is observed in the right dorsal subpleural area (black arrow)![]() 图 2 患者,男,非重症组,63岁,发热5 d,伴咳嗽、咳痰,SPO2 97%。左肺胸膜下多发斑片状磨玻璃密度影Figure 2. A 63-year-old male patient in the non-critical group had a fever for 5 days with cough and sputum and SPO2 97%. There are multiple patchy ground-glass opacities in the subpleural area of the left lung
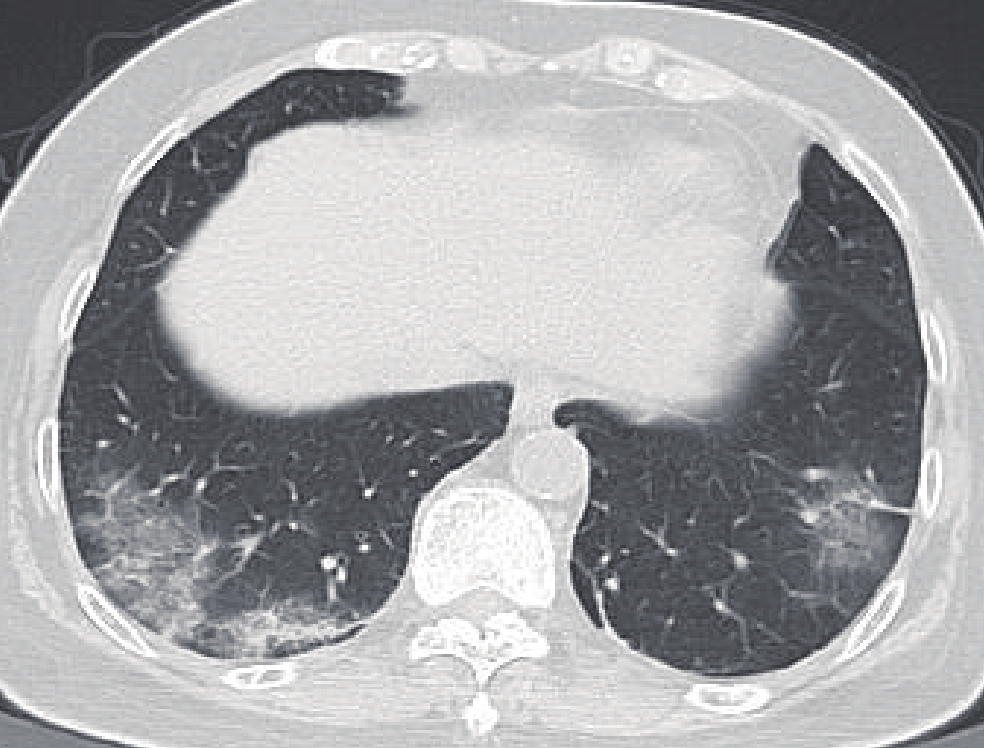
图 2 患者,男,非重症组,63岁,发热5 d,伴咳嗽、咳痰,SPO2 97%。左肺胸膜下多发斑片状磨玻璃密度影Figure 2. A 63-year-old male patient in the non-critical group had a fever for 5 days with cough and sputum and SPO2 97%. There are multiple patchy ground-glass opacities in the subpleural area of the left lung![]() 图 3 患者,女,非重症组,74岁,间断发热1周余,伴口干、厌食,Tmax 38.2℃,SPO2 98%。双下肺见不规则斑片状实变及磨玻璃密度影Figure 3. A 74-year-old female patient in the non-critical group had an intermittent fever for more than 1 week, accompanied by dry mouth and anorexia, Tmax 38.2℃, and SPO2 98%. Irregular patchy high-density shadows are observed in both lower lungs
图 3 患者,女,非重症组,74岁,间断发热1周余,伴口干、厌食,Tmax 38.2℃,SPO2 98%。双下肺见不规则斑片状实变及磨玻璃密度影Figure 3. A 74-year-old female patient in the non-critical group had an intermittent fever for more than 1 week, accompanied by dry mouth and anorexia, Tmax 38.2℃, and SPO2 98%. Irregular patchy high-density shadows are observed in both lower lungs![]() 图 4 患者,男,重症组,68岁,发热1周,伴咽痒、咳嗽,Tmax 39.3℃,SPO2 95%。右肺可见大片状磨玻璃密度影,胸膜内分布,可见胸膜下黑线(黑箭)Figure 4. A 68-year-old male patient in the critical group had a fever for 1 week accompanied by an itchy throat and cough, Tmax 39.3℃, and SPO2 95%. A large flake of ground-glass opacity is seen in the right lung, distributed within the pleura, with a black subpleural line(black arrow)
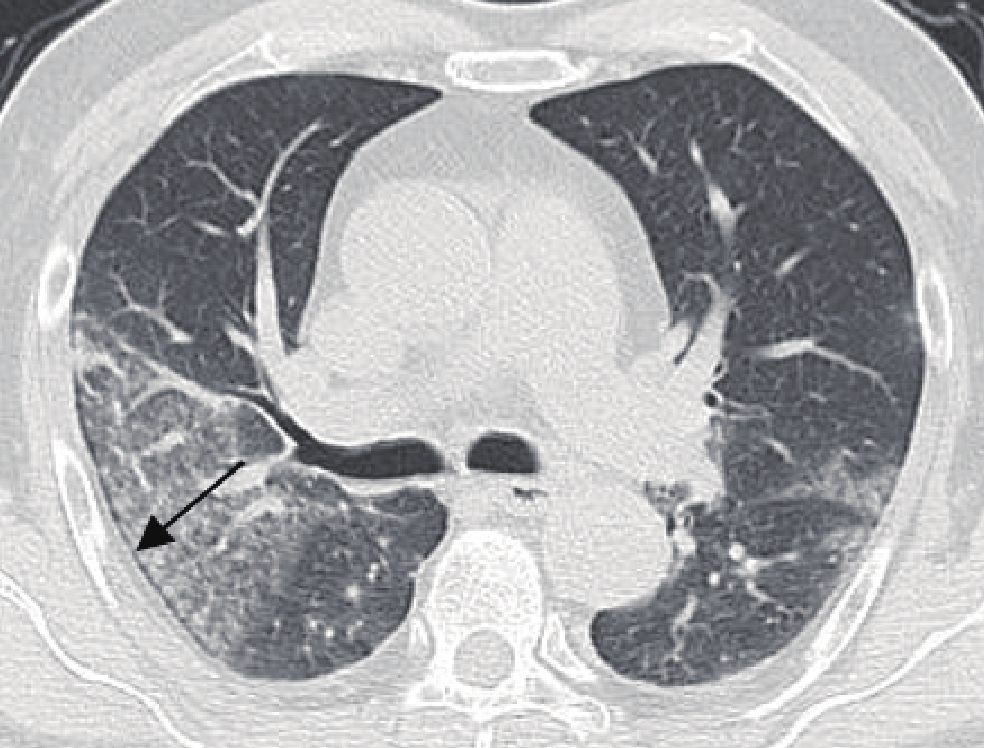
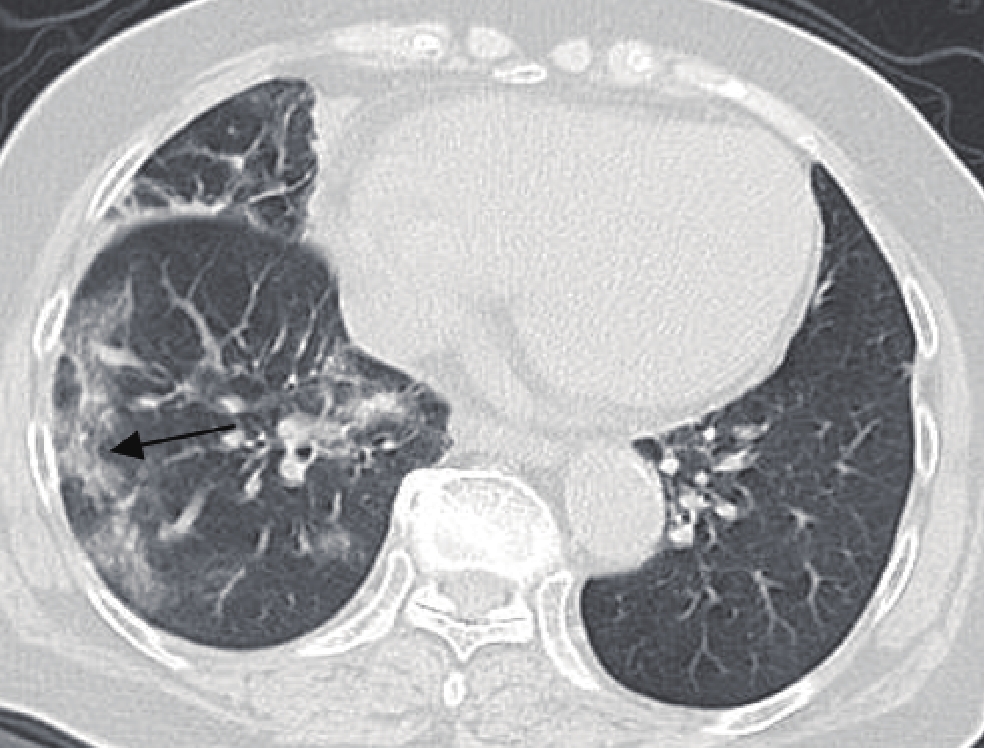
图 4 患者,男,重症组,68岁,发热1周,伴咽痒、咳嗽,Tmax 39.3℃,SPO2 95%。右肺可见大片状磨玻璃密度影,胸膜内分布,可见胸膜下黑线(黑箭)Figure 4. A 68-year-old male patient in the critical group had a fever for 1 week accompanied by an itchy throat and cough, Tmax 39.3℃, and SPO2 95%. A large flake of ground-glass opacity is seen in the right lung, distributed within the pleura, with a black subpleural line(black arrow)![]() 图 5 患者,女,重症组,87岁,咳嗽数天,发热1 h,Tmax 39.0℃,SPO2 89%~90%。右肺见斑片状实变及磨玻璃密度影,边缘略模糊,局部可见拱廊征(黑箭)Figure 5. An 87-year-old female patient in the critical group had a fever for 1 hour with cough for several days, Tmax 39.0℃, and SPO2 89%~90%. Patchy consolidation and ground-glass opacity are seen in the right lung, with slightly blurred edges and arcade-like sign (black arrow)
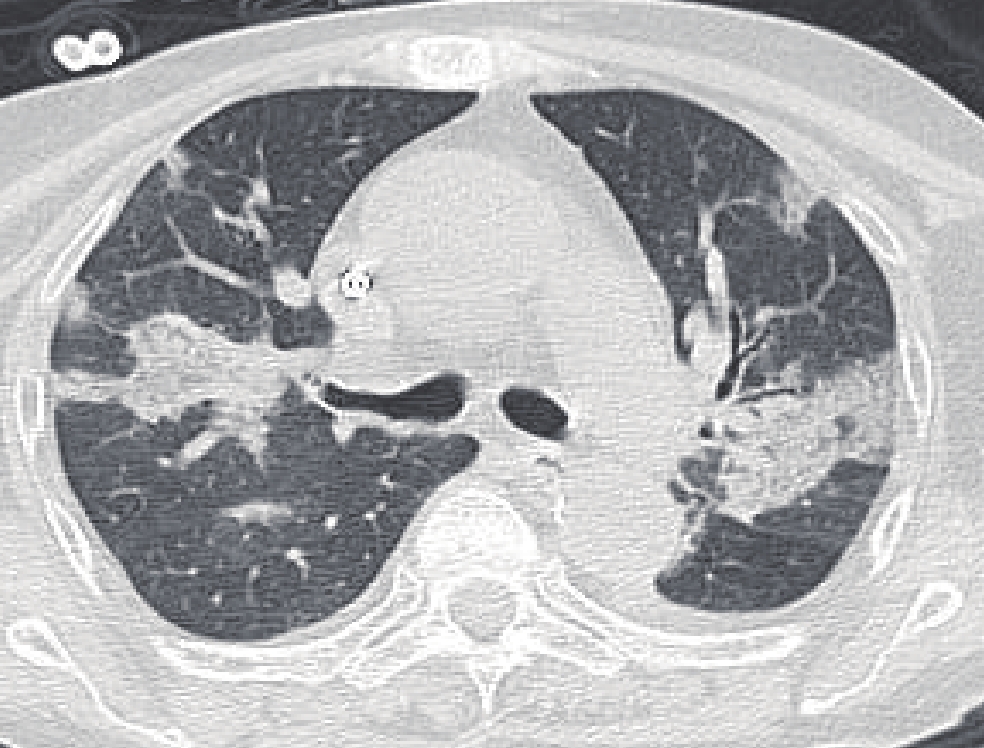
图 5 患者,女,重症组,87岁,咳嗽数天,发热1 h,Tmax 39.0℃,SPO2 89%~90%。右肺见斑片状实变及磨玻璃密度影,边缘略模糊,局部可见拱廊征(黑箭)Figure 5. An 87-year-old female patient in the critical group had a fever for 1 hour with cough for several days, Tmax 39.0℃, and SPO2 89%~90%. Patchy consolidation and ground-glass opacity are seen in the right lung, with slightly blurred edges and arcade-like sign (black arrow)![]() 图 6 患者,女,重症组,83岁,发热7 d,伴咳嗽、咳痰,Tmax 39.0℃,SPO2 90.1%。双肺周围对称性分布片状磨玻璃密度影,其内可见铺路石征Figure 6. An 83-year-old female patient in the critical group had a fever for 7 days with cough and sputum, Tmax 39.0℃, and SPO2 90.1%. The ground-glass opacities are symmetrically distributed around both lungs, and the paving stone sign can be seen within them
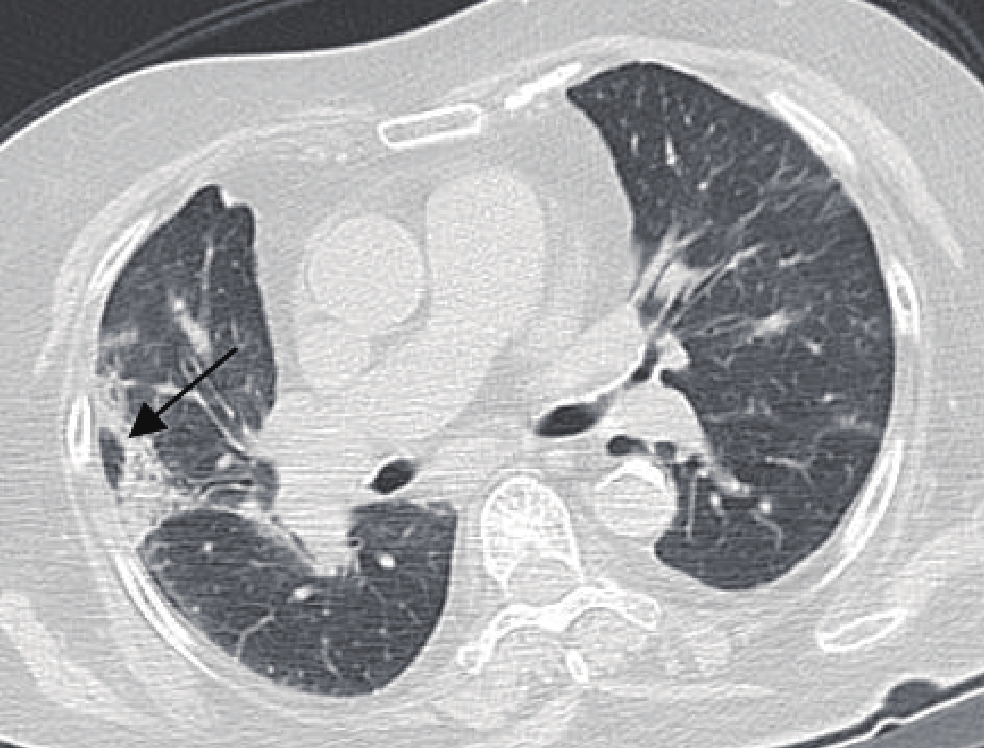
图 6 患者,女,重症组,83岁,发热7 d,伴咳嗽、咳痰,Tmax 39.0℃,SPO2 90.1%。双肺周围对称性分布片状磨玻璃密度影,其内可见铺路石征Figure 6. An 83-year-old female patient in the critical group had a fever for 7 days with cough and sputum, Tmax 39.0℃, and SPO2 90.1%. The ground-glass opacities are symmetrically distributed around both lungs, and the paving stone sign can be seen within them![]() 图 7 患者,女,重症组,74岁,发热13 d,伴腹泻、呕吐、全身酸痛、咳嗽,Tmax 37.4℃。双肺多发实变影,沿支气管血管束分布,边缘清楚Figure 7. A 74-year-old female patient in the critical group had a fever for 13 days, accompanied by diarrhea, emesis, body ache, cough, and Tmax 37.4℃. Multiple consolidations in both lungs are distributed along the bronchial vascular bundle with clear edges
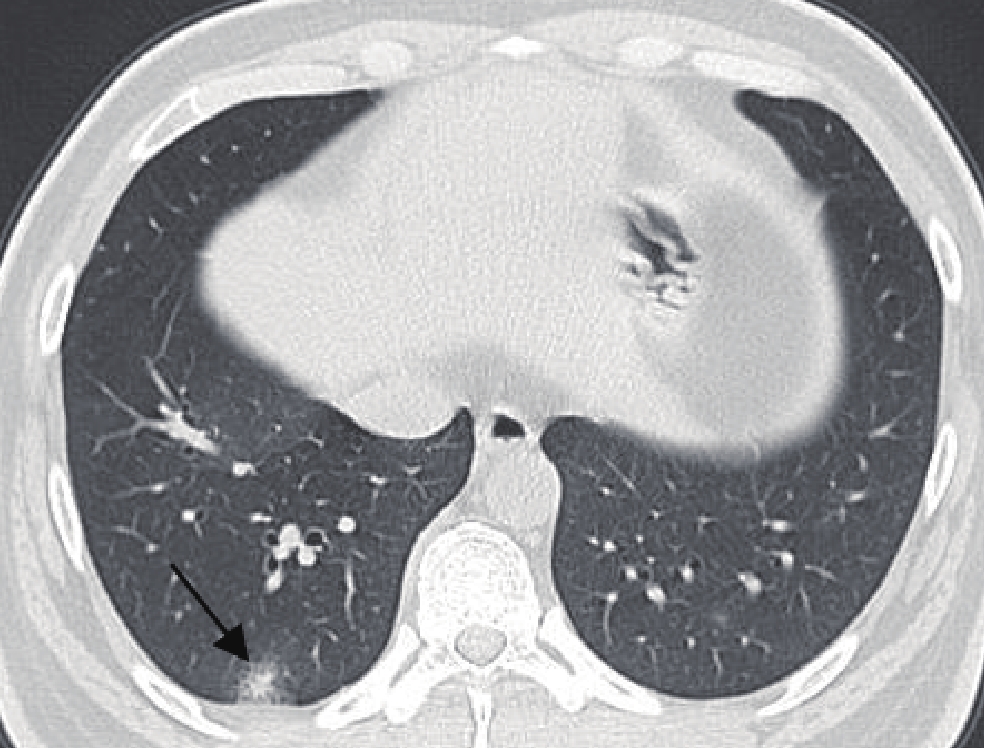
图 7 患者,女,重症组,74岁,发热13 d,伴腹泻、呕吐、全身酸痛、咳嗽,Tmax 37.4℃。双肺多发实变影,沿支气管血管束分布,边缘清楚Figure 7. A 74-year-old female patient in the critical group had a fever for 13 days, accompanied by diarrhea, emesis, body ache, cough, and Tmax 37.4℃. Multiple consolidations in both lungs are distributed along the bronchial vascular bundle with clear edges![]() 图 8 患者,女,重症组,89岁,发热10 d,伴心悸,Tmax 38.5℃。右下肺胸膜下见束带状高密度影(黑箭)Figure 8. An 89-year-old female patient in the critical group had a fever for 10 days with palpitation and Tmax 38.5℃. A band-shaped high-density shadow is observed in the subpleural area of the lower lobe of the right lung (black arrow)表 2 不同分型的新冠病毒感染患者的肺部CT表现Table 2. Imaging findings of different subtypes of patients with COVID-19
图 8 患者,女,重症组,89岁,发热10 d,伴心悸,Tmax 38.5℃。右下肺胸膜下见束带状高密度影(黑箭)Figure 8. An 89-year-old female patient in the critical group had a fever for 10 days with palpitation and Tmax 38.5℃. A band-shaped high-density shadow is observed in the subpleural area of the lower lobe of the right lung (black arrow)表 2 不同分型的新冠病毒感染患者的肺部CT表现Table 2. Imaging findings of different subtypes of patients with COVID-19项目 参数 组别 P 非重型(n=110) 重型(n=24) 数量 单个 2(1.8) 0(0.0) 1.000 多个 108(95.5) 24(100.0) 1.000 ≤5个 14(12.7) 1(4.2) 0.397 ≤10个 24(21.8) 1(4.2) 0.085 >10个 70(63.6) 22(91.7) 0.007 部位 单肺 17(15.5) 1(4.2) 0.255 单叶 10(9.1) 0(0.0) 0.268 双肺 94(85.5) 23(95.8) 0.296 分布 对称 57(51.8) 19(79.2) 0.014 非叶段 94(85.5) 23(95.8) 0.296 周围 108(98.2) 23(95.8) 0.450 膜下 76(69.1) 21(87.5) 0.068 膜内 104(94.5) 23(95.8) 1.000 中央 95(86.4) 21(87.5) 1.000 血管束 95(86.4) 21(87.5) 1.000 血管外 10(9.1) 4(16.7) 0.465 病变分布优势 上肺为主 14(12.7) 2(8.3) 0.799 下肺为主 50(45.5) 7(29.2) 0.144 周围为主 53(48.2) 5(20.8) 0.014 中央为主 20(18.2) 4(16.7) 1.000 弥漫 38(34.5) 15(62.5) 0.011 病变类型 磨玻璃 102(92.7) 24(100.0) 0.375 实变 50(45.5) 12(50.0) 0.686 网格 87(79.1) 22(91.7) 0.253 蜂窝 10(9.1) 1(4.2) 0.700 混合 100(90.9) 24(100.0) 0.268 病变边缘 模糊 62(56.4) 8(33.3) 0.041 不规则 54(49.1) 7(29.2) 0.076 光整 1(0.9) 0(0.0) 1.000 分叶 5(4.5) 0(0.0) 0.585 毛刺 24(21.8) 3(12.5) 0.453 形态类型 结节 91(82.7) 18(75.0) 0.554 树芽 42(38.2) 5(20.8) 0.107 斑片 89(80.9) 23(95.8) 0.138 大片 57(51.8) 19(79.2) 0.014 束带状 38(34.5) 17(70.8) 0.001 肿块样 0(0.0) 1(4.2) 0.179 混合 97(88.2) 23(95.8) 0.458 征象 小气道壁厚 84(76.4) 15(62.5) 0.161 血管束增厚 44(40.0) 24(100.0) 0.000 晕征 80(72.7) 18(75.0) 0.820 反晕征 39(35.5) 13(54.2) 0.088 铺路石 63(57.3) 19(79.2) 0.046 支气管充气征 78(70.9) 21(87.5) 0.094 空气潴留征 38(34.5) 6(25.0) 0.367 拱廊征 38(34.5) 15(62.5) 0.011 煎蛋征 63(57.3) 8(33.3) 0.033 胸膜凹陷征 21(19.1) 4(16.7) 1.000 胸膜尾征 54(49.1) 8(33.3) 0.161 分叶征 11(10.0) 1(4.2) 0.608 空泡征 62(56.4) 17(70.8) 0.192 毛刺征 50(45.5) 11(45.8) 0.973 内部索条 35(31.8) 4(16.7) 0.139 胸膜下黑带 59(53.6) 19(79.2) 0.022 胸膜下线 29(26.4) 4(16.7) 0.318 牵拉性支扩 61(55.5) 17(70.8) 0.166 纤维索条 75(68.2) 17(70.8) 0.800 3. 讨论
3.1 新型冠状病毒感染的临床特点
COVID-19是一种新型呼吸道传染性疾病,其致病病原体为一种单链RNA病毒SARS-CoV-2,该病有较强的传染性且人群普遍易感[4]。该病发病机制尚不十分清楚,可能是由病毒的S-蛋白与人血管紧张素转化酶Ⅱ相互作用感染人呼吸道上皮细胞所致[6]。其组织病理学包括:肺泡弥漫性损伤,肺泡间隔充血、水肿,单核细胞和淋巴细胞弥漫浸润,Ⅱ型肺泡上皮细胞显著增生并脱落,肺透明膜形成,微血管透明血栓的形成;疾病进展时肺泡腔内渗出实变,肺组织出现灶性出血及出血性梗死,肺泡腔渗出物机化以及肺间质纤维化导致肺泡结构破坏[7-8]。患者通常有流行病学史,临床表现主要为发热、咳嗽、咳痰、咽痛、肌痛、腹泻等[9]。老年人以及合并基础病的患者预后较差。
本研究按照临床分型将新冠患者分为非重症组和重症组,两组之间合并基础病、合并糖尿病的差异有统计学意义,提示合并基础病的患者尤其是合并糖尿病的患者更容易出现重症感染,这与既往研究结果一致[10],可能与机体免疫能力有关,具体原因和机制有待进一步研究。
3.2 不同分型的新型冠状病毒感染的肺部CT表现对比分析
胸部薄层CT平扫对于COVID-19的诊断具有独特优势,其可以显示肺部病变的影像学特征和累及范围,对于COVID-19的诊断以及分型具有指导价值。既往文献[3-5]报道,COVID-19肺部CT早期表现主要为多发斑片状或结节状磨玻璃密度影,双下肺外周背侧分布为主,多靠近胸膜并与胸膜平行,可伴有实变影及小叶间隔增厚,病灶内可见支气管充气征及血管束增粗等表现;随着疾病进展,病灶数量增多、范围增大,逐渐沿支气管血管束从外周向中央扩展,病灶密度增高,磨玻璃、实变或索条影等多种形态病变混合存在,可伴有牵拉性支扩,少数患者可见少量胸腔积液;严重者双肺呈弥漫性病变,实变影为主,部分患者呈“白肺”改变,可伴有支气管扩张、肺结构扭曲及肺不张等改变。
本组研究发现,在COVID-19非重症组与重症组之间,在病灶数量、分布、边缘、形态、血管束增粗表现上有所差异。COVID-19肺部影像学大多表现为多发病灶,本组研究中多发病灶发生率为98.5%,可能是由于新冠病毒为RNA病毒,需要病毒在肺内达到一定数量才可致病,两组之间病灶数量>10个的差异具有统计学意义,提示重症患者的病灶数量多大于10个,这可能与肺内病毒感染数量有关。
两组间周围为主分布、对称分布、弥漫分布以及大片状形态的差异具有统计学意义,非重症组周围为主分布的发生率(48.2%)高于重症组(20.8%),而重症组对称分布(79.2%)、弥漫分布(62.5%)以及大片状形态(79.2%)的发生率高于非重症组(51.8%、34.5% 和51.8%),这可能与疾病的发展过程有关,疾病早期,病变多分布于胸膜下和肺外周1/3,这可能与病毒直径较小,可以很快通过支气管首先到达胸膜下气体交换区域有关[11]。
随着疾病进展,病变数量逐渐增多,病灶逐渐融合呈大片状,向肺门或沿胸膜下蔓延至多个肺叶呈弥漫对称分布。两组间病变边缘模糊的差异具有统计学意义,且非重症组(56.4%)发生率高于重症组(33.3%),可能是由于非重症组病毒数量相对少且病毒直径小,容易通过肺泡孔扩散,引起邻近肺泡腔渗出所致[12],而重症组患者疾病进展较快,肺泡渗出增多,病灶密度增高,边缘相对清晰;两组间束带状形态的差异具有统计学意义,且重症组(70.8%)发生率高于非重症组(34.5%),可能是由于重症组患者疾病进程快,病灶此消彼长,呈现形态不规则、密度不均质、类型混杂性的特点[13],平行于胸膜的部分病灶出现机化收缩而呈现束带状。两组间血管束增粗的差异具有统计学意义,且重症组(100.0%)发生率高于非重症组(40.0%),可能是由于重症组患者血管周围间质水肿更重所致。
既往文献[3-5,14-15]报道,COVID-19的肺部CT表现多伴有晕征、反晕征、铺路石征及支气管充气征等征象,而未有文献报道不同分型的COVID-19患者的影像学特殊征象的差异。铺路石征是指在磨玻璃密度病灶内可见网格影,两组间铺路石征的差异具有统计学意义,且重症组(79.2%)发生率高于非重症组(57.3%),可能是由于疾病早期主要以肺泡壁增厚、肺泡内浆液渗出为主,而间质增厚较少,随着疾病进展肺泡间隔扩张充血、小血管网增多以及小叶间隔间质水肿,从而铺路石征的表现增多[16]。
煎蛋征是指亚实性结节,即中心为实性成分、周围伴磨玻璃密度影的结节灶,两组间煎蛋征的差异具有统计学意义,且非重症组(57.3%)发生率高于重症组(33.3%),可能是由于病变早期结节样病灶相对多见,并且磨玻璃密度结节中心区域肺泡进一步损伤所致,而重症组患者病灶逐渐融合为片状,煎蛋样结节状病灶相对少见;拱廊征是指边缘清晰而弯曲的实变带,与胸膜围成拱形,是机化与纤维化的表现之一[13],两组间拱廊征的差异具有统计学意义,且重症组(62.5%)发生率高于非重症组(34.5%),可能是由于重症组疾病发展呈现更明显的多形性及混杂性,部分病灶内出现纤维化改变,可能表示该处肺组织处于修复状态。
3.3 研究的局限性
本研究的局限性:①未纳入临床实验室指标、治疗方法及患者预后等进行比较;②单纯比较不同分型新冠感染患者的影像学表现,未能进一步探讨影像分型与临床分型的相关性;③本研究以患者首诊 CT表现为主,未能进一步观察不同分型患者肺部病灶的动态演变规律。
综上所述,胸部薄层CT平扫能够明确COVID-19患者肺部异常影像学表现,准确评估病灶数量、分布范围、形态特点,其中病灶数量、分布特点、病灶边缘、形态类型及铺路石征、拱廊征、煎蛋征等特殊征象能够有效提示COVID-19的分型,对于COVID-19的精准诊断、治疗选择及患者预后具有重要意义。
-
![]()
图 1 患者,男,非重症组,41岁,发热5 d,伴咽痛、流涕、咳嗽,Tmax 38.2℃,SPO2 98%。右肺背侧胸膜下见不规则煎蛋征(亚实性结节)(黑箭)
Figure 1. A 41-year-old male patient in the non-critical group had a fever for 5 days, accompanied by sore throat, running nose, cough, Tmax 38.2℃, and SPO2 98%. Irregular fried egg sign is observed in the right dorsal subpleural area (black arrow)
![]()
图 2 患者,男,非重症组,63岁,发热5 d,伴咳嗽、咳痰,SPO2 97%。左肺胸膜下多发斑片状磨玻璃密度影
Figure 2. A 63-year-old male patient in the non-critical group had a fever for 5 days with cough and sputum and SPO2 97%. There are multiple patchy ground-glass opacities in the subpleural area of the left lung
![]()
图 3 患者,女,非重症组,74岁,间断发热1周余,伴口干、厌食,Tmax 38.2℃,SPO2 98%。双下肺见不规则斑片状实变及磨玻璃密度影
Figure 3. A 74-year-old female patient in the non-critical group had an intermittent fever for more than 1 week, accompanied by dry mouth and anorexia, Tmax 38.2℃, and SPO2 98%. Irregular patchy high-density shadows are observed in both lower lungs
![]()
图 4 患者,男,重症组,68岁,发热1周,伴咽痒、咳嗽,Tmax 39.3℃,SPO2 95%。右肺可见大片状磨玻璃密度影,胸膜内分布,可见胸膜下黑线(黑箭)
Figure 4. A 68-year-old male patient in the critical group had a fever for 1 week accompanied by an itchy throat and cough, Tmax 39.3℃, and SPO2 95%. A large flake of ground-glass opacity is seen in the right lung, distributed within the pleura, with a black subpleural line(black arrow)
![]()
图 5 患者,女,重症组,87岁,咳嗽数天,发热1 h,Tmax 39.0℃,SPO2 89%~90%。右肺见斑片状实变及磨玻璃密度影,边缘略模糊,局部可见拱廊征(黑箭)
Figure 5. An 87-year-old female patient in the critical group had a fever for 1 hour with cough for several days, Tmax 39.0℃, and SPO2 89%~90%. Patchy consolidation and ground-glass opacity are seen in the right lung, with slightly blurred edges and arcade-like sign (black arrow)
![]()
图 6 患者,女,重症组,83岁,发热7 d,伴咳嗽、咳痰,Tmax 39.0℃,SPO2 90.1%。双肺周围对称性分布片状磨玻璃密度影,其内可见铺路石征
Figure 6. An 83-year-old female patient in the critical group had a fever for 7 days with cough and sputum, Tmax 39.0℃, and SPO2 90.1%. The ground-glass opacities are symmetrically distributed around both lungs, and the paving stone sign can be seen within them
![]()
图 7 患者,女,重症组,74岁,发热13 d,伴腹泻、呕吐、全身酸痛、咳嗽,Tmax 37.4℃。双肺多发实变影,沿支气管血管束分布,边缘清楚
Figure 7. A 74-year-old female patient in the critical group had a fever for 13 days, accompanied by diarrhea, emesis, body ache, cough, and Tmax 37.4℃. Multiple consolidations in both lungs are distributed along the bronchial vascular bundle with clear edges
![]()
图 8 患者,女,重症组,89岁,发热10 d,伴心悸,Tmax 38.5℃。右下肺胸膜下见束带状高密度影(黑箭)
Figure 8. An 89-year-old female patient in the critical group had a fever for 10 days with palpitation and Tmax 38.5℃. A band-shaped high-density shadow is observed in the subpleural area of the lower lobe of the right lung (black arrow)
表 1 134例新冠病毒感染患者的临床特点
Table 1 Clinical characteristics of 134 patients with COVID-19
项目 组别 P 非重症组(n=110) 重症组(n=24) 年龄 68.5±15.2 74.3±12.6 0.090 性别 男 58(52.7) 15(62.5) 0.384 女 52(47.3) 9(37.5) 0.384 平均病程/d 5.0 5.0 0.970 临床特征/例 发热 104(94.5) 22(91.7) 0.949 咳嗽 100(90.9) 20(83.3) 0.465 咽痛 35(31.8) 7(29.2) 0.800 胸闷 11(10.0) 3(12.5) 1.000 肌痛 17(15.5) 4(16.7) 1.000 腹泻 8(7.3) 1(4.2) 0.920 纳差 2(1.8) 1(4.2) 0.450 合并基础病/例 67(60.9) 20(83.3) 0.037 基础病类型/例 高血压 42(38.2) 12(50.0) 0.285 糖尿病 28(25.5) 11(45.8) 0.046 冠心病 22(20.0) 9(37.5) 0.065 脑血管病 16(14.5) 3(12.5) 1.000  下载: 导出CSV
表 2 不同分型的新冠病毒感染患者的肺部CT表现
Table 2 Imaging findings of different subtypes of patients with COVID-19
项目 参数 组别 P 非重型(n=110) 重型(n=24) 数量 单个 2(1.8) 0(0.0) 1.000 多个 108(95.5) 24(100.0) 1.000 ≤5个 14(12.7) 1(4.2) 0.397 ≤10个 24(21.8) 1(4.2) 0.085 >10个 70(63.6) 22(91.7) 0.007 部位 单肺 17(15.5) 1(4.2) 0.255 单叶 10(9.1) 0(0.0) 0.268 双肺 94(85.5) 23(95.8) 0.296 分布 对称 57(51.8) 19(79.2) 0.014 非叶段 94(85.5) 23(95.8) 0.296 周围 108(98.2) 23(95.8) 0.450 膜下 76(69.1) 21(87.5) 0.068 膜内 104(94.5) 23(95.8) 1.000 中央 95(86.4) 21(87.5) 1.000 血管束 95(86.4) 21(87.5) 1.000 血管外 10(9.1) 4(16.7) 0.465 病变分布优势 上肺为主 14(12.7) 2(8.3) 0.799 下肺为主 50(45.5) 7(29.2) 0.144 周围为主 53(48.2) 5(20.8) 0.014 中央为主 20(18.2) 4(16.7) 1.000 弥漫 38(34.5) 15(62.5) 0.011 病变类型 磨玻璃 102(92.7) 24(100.0) 0.375 实变 50(45.5) 12(50.0) 0.686 网格 87(79.1) 22(91.7) 0.253 蜂窝 10(9.1) 1(4.2) 0.700 混合 100(90.9) 24(100.0) 0.268 病变边缘 模糊 62(56.4) 8(33.3) 0.041 不规则 54(49.1) 7(29.2) 0.076 光整 1(0.9) 0(0.0) 1.000 分叶 5(4.5) 0(0.0) 0.585 毛刺 24(21.8) 3(12.5) 0.453 形态类型 结节 91(82.7) 18(75.0) 0.554 树芽 42(38.2) 5(20.8) 0.107 斑片 89(80.9) 23(95.8) 0.138 大片 57(51.8) 19(79.2) 0.014 束带状 38(34.5) 17(70.8) 0.001 肿块样 0(0.0) 1(4.2) 0.179 混合 97(88.2) 23(95.8) 0.458 征象 小气道壁厚 84(76.4) 15(62.5) 0.161 血管束增厚 44(40.0) 24(100.0) 0.000 晕征 80(72.7) 18(75.0) 0.820 反晕征 39(35.5) 13(54.2) 0.088 铺路石 63(57.3) 19(79.2) 0.046 支气管充气征 78(70.9) 21(87.5) 0.094 空气潴留征 38(34.5) 6(25.0) 0.367 拱廊征 38(34.5) 15(62.5) 0.011 煎蛋征 63(57.3) 8(33.3) 0.033 胸膜凹陷征 21(19.1) 4(16.7) 1.000 胸膜尾征 54(49.1) 8(33.3) 0.161 分叶征 11(10.0) 1(4.2) 0.608 空泡征 62(56.4) 17(70.8) 0.192 毛刺征 50(45.5) 11(45.8) 0.973 内部索条 35(31.8) 4(16.7) 0.139 胸膜下黑带 59(53.6) 19(79.2) 0.022 胸膜下线 29(26.4) 4(16.7) 0.318 牵拉性支扩 61(55.5) 17(70.8) 0.166 纤维索条 75(68.2) 17(70.8) 0.800
下载: 导出CSV
-
[1] WANG D, HU B, HU C, et al. Clinical characteristics of 138 hospitalized patients with 2019 novel coronavirus-infected pneumonia in Wuhan, China[J]. Journal of the American Medical Association, 2020, 323(11): 1061−1069. doi: 10.1001/jama.2020.1585
[2] 国家卫生健康委办公厅. 新型冠状病毒感染诊疗方案(试行第十版)[EB/OL]. (2023-01-06) [2023-03-07]. http://www.nhc.gov.cn/ylyjs/pqt/202301/32de5b2ff9bf4eaa88e75bdf7223a65a.shtml. [3] CHUNG M, BERNHEIM A, MEI X, et al. CT imaging features of 2019 novel coronavirus (2019-nCoV)[J]. Radiology, 2020, 295(1): 202−207. doi: 10.1148/radiol.2020200230
[4] ZHU Y, GAO Z H, LIU Y L, et al. Clinical and CT imaging features of 2019 novel coronavirus disease (COVID-19)[J]. The Journal of Infection, 2020, 81(1): 147−178.
[5] 管汉雄, 熊颖, 申楠茜, 等. 新型冠状病毒肺炎(COVID-19)临床影像学特征[J]. 放射学实践, 2020,35(2): 125−130. GUAN H X, XIONG Y, SHEN N X, et al. Clinical and thin-section CT features of patients with 2019-nCoV-pneumonia[J]. Radiologic Practice, 2020, 35(2): 125−130. (in Chinese).
[6] YAN R, ZHANG Y, LI Y, et al. Structural basis for the recognition of SARS-CoV-2 by full-length human ACE2[J]. Science, 2020, 367(6485): 1444−1448. doi: 10.1126/science.abb2762
[7] XU Z, SHI L, WANG Y, et al. Pathological findings of COVID-19 associated with acute respiratory distress syndrome[J]. Lancet Respiratory Medicine, 2020, 8(4): 420−422. doi: 10.1016/S2213-2600(20)30076-X
[8] TIAN S, HU W, NIU L, et al. Pulmonary pathology of early-phase 2019 novel coronavirus (COVID-19) pneumonia in two patients with lung cancer[J]. Journal of Thoracic Oncology, 2020, 15(5): 700−704. doi: 10.1016/j.jtho.2020.02.010
[9] HUANG C, WANG Y, LI X, et al. Clinical features of patients infected with 2019 novel coronavirus in Wuhan, China[J]. Lancet, 2020, 395(10223): 497−506. doi: 10.1016/S0140-6736(20)30183-5
[10] GUAN W J, NI Z Y, HU Y, et al. China medical treatment expert group for COVID-19: Clinical characteristics of coronavirus disease 2019 in China[J]. The New England Journal of Medicine, 2020, 382(18): 1708−1720. doi: 10.1056/NEJMoa2002032
[11] 车宏伟, 张晓琴, 柴军, 等. 新型冠状病毒肺炎临床表现及CT影像学分析[J]. CT理论与应用研究, 2021,30(4): 525−532. DOI: 10.15953/j.1004-4140.2021.30.04.14. CHE H W, ZHANG X Q, CHAI J, et al. Clinical manifestations and CT imaging analysis of corona virus disease 2019[J]. CT Theory and Applications, 2021, 30(4): 525−532. DOI: 10.15953/j.1004-4140.2021.30.04.14. (in Chinese).
[12] 史河水, 韩小雨, 樊艳青, 等. 新型冠状病毒(2019-nCoV)感染的肺炎临床特征及影像学表现[J]. 临床放射学杂志, 2020,39(1): 8−11. SHI H S, HAN X Y, FAN Y Q, et al. Radiologic features of patients with 2019-nCoV infection[J]. Journal of Clinical Radiology, 2020, 39(1): 8−11. (in Chinese).
[13] 孙莹, 李玲, 刘晓燕, 等. 早期新型冠状病毒肺炎的胸部薄层平扫CT表现特征[J]. CT理论与应用研究, 2023,32(1): 131−138. DOI: 10.15953/j.ctta.2023.006. SUN Y, LI L, LIU X Y, et al. Imaging features of early COVID-19 on chest thin-slice non-enhanced CT[J]. CT Theory and Applications, 2023, 32(1): 131−138. DOI: 10.15953/j.ctta.2023.006. (in Chinese).
[14] SHI H, HAN X, ZHENG C. Evolution of CT manifestations in a patient recovered from 2019 novel coronavirus (2019-nCoV) pneumonia in Wuhan, China[J]. Radiology, 2020, 295(1): 20. doi: 10.1148/radiol.2020200269
[15] PAN F, YE T, SUN P, et al. Time course of lung changes at chest CT during recovery from coronavirus disease 2019 (COVID-19)[J]. Radiology, 2020, 295(3): 715−721. doi: 10.1148/radiol.2020200370
[16] KOO H J, LIM S, CHOE J, et al. Radiographic and CT features of viral pneumonia[J]. Radiographics, 2018, 38(3): 719−739. doi: 10.1148/rg.2018170048


计量
- 文章访问数: 212
- HTML全文浏览量: 146
- PDF下载量: 17